

Dr. John Lott and CPRC senior fellow Kesten Green, who is also a researcher at the Adelaide University, College of Business and Law, compared the violent crime rates in Australia and the United States. Australian are clearly at much greater risk of violent crime than Americans, so why not let Australians protect themselves. We have previously written on the impact of the 1996/97 confiscation in Australia on homicide and suicide rates.
.
There are about 65,000 police in Australia, so there are at most about 22,000 police on duty at any point in time for a population of 27.5 million — that means there is only one officer on duty to protect every 1,250 Australians. There are no national numbers on police response times, but there are some local numbers. In New South Wales, the most populous state, the average police response time for urgent calls was 11 minutes and 2 seconds, with about 7 to 10 minutes in urban commands. In 2024-25, for police response times in Western Australia involving priority codes for imminent threats and for urgent calls were at 80% of incidents within 12 minutes.
.
For the Bondi Beach massacre, the first shots were fired at 6:42 PM AEDT when the gunmen began shooting into the crowd from a footbridge. The first emergency calls went out at 6:45 PM, and police were said to open fire on the attackers at 6:47 to 6:49 PM. Whether it is five or seven minutes before police were able to start firing their guns it was enough time for 15 people to be murdered and more than 40 wounded. This is about twice the average number of people murdered in mass public shootings in the United States since 1998.
.
Below we will look at recent data on the gap between Australia and the US crime rates, but that gap has been long standing. The International Crime Victimization Survey (available here) shows the gaps for earlier years. For 2000, only the motor cycle and bicycle theft rates per capital per 1,000 people is lower in Australia than the US. The violent crime rate (robbery, sexual incidents, and assaults and threats) was 104% higher in Australia than the US. For the other crime rates besides motor cycles and bicycles, they range from 11.1% (theft from a car) to 150% (robbery) higher in Australia than the US. The big advantage of the International Crime Victimization Survey is that it asks the same questions and ensures that the crimes are defined in exactly the same way.
| The 2000 International Crime Victimization Survey | ||||||||||||
| Ten crimes | Car theft | theft from car | car vandalism | Motor cycle theft | Bicycle theft | Burglary | Attempted Burglary | Robbery | Personal Thefts | Sexual Incidents | Assualts and Threats | |
| Australia | 54.3 | 2 | 9 | 11.6 | 0.1 | 2.2 | 4.8 | 4 | 1.5 | 8 | 7.5 | 11.2 |
| US | 39.5 | 0.6 | 8.1 | 9.2 | 0.3 | 2.7 | 3.3 | 3.3 | 0.6 | 6.7 | 2.8 | 6.5 |
| 37.5% | 233.3% | 11.1% | 26.1% | -66.7% | -18.5% | 45.5% | 21.2% | 150.0% | 19.4% | 167.9% | 72.3% | |
.
The US experienced a serious violent crime increase of 59 percent during the Biden administration. Despite that increase, Americans remained safer from violent crime than Australians. Yes, you did just read that Australians are more likely to be victims of violent crime than Americans; much more, in fact.
.
In the most recent comparable years, surveys show that the U.S. violent victimization rate was 23.3 per 1,000 people, while Australia’s rate reached 39 per 1,000 respondents who reported being victims of “one or more selected personal crimes.” Even with measurement differences, Australia’s victimization rate was 67 percent higher—an estimate that, as we explain below, likely understates how much more frequently Australians experience crime relative to Americans.
.
.
We note that US citizens have far greater and easier access to firearms for self-defense and defense of others than do Australians, and that legislation, regulation, and enforcement in the US is much more supportive of defensive use of firearms than is the case in Australia. There are more than 1.6 million defensive gun uses each year in the US, almost 21 million holders of permits to carry a concealed handgun, and in 29 of the 50 US states a permit is not needed.
.
In this short review of the statistics, we emphasise total per capita violent crime estimates from crime victimisation surveys, rather than from the subset of violent crime that was reported to the police. (Reporting of crime is low in both countries, with reporting rates under 60 percent for all categories.) For the US, the figures are from the Bureau of Justice Criminal Victimization report for 2024 (NCVS) and, for Australia, from the Australian Bureau of Statistics Crime Victimisation report for the 2023-24 financial year (ABS).
.
The US crime victimisation survey includes 240,000 respondents and the Australian 26,176, which represent broadly similar proportions of the respective countries’ total populations. The US and Australian national surveys are related to the International Crime Victimization Survey (ICVS) which was last conducted in full in 2005. The surveys capture 12-month periods and capture both crimes that were reported to the police, and those that were not.
.
Comparisons between the US and Australian victimisation rates for key violent crime categories are summarised in the table, below. There is an important difference between the surveys: the Australia data is the proportion of people or of households that have been victimized by crime at least once during the year, whereas the US data are based on counts of crimes. That is, when an Australian is robbed twice in one year, only one victimisation is reported in the ABS statistics. In the US’s NCVS, that would count as two victimisations. The figures in Column C in the table below are indicative repeat victimization multipliers estimated from data presented in a 2015 Center for Problem-Oriented Policing Conference report “Analyzing Repeat Victimization” and are used to calculate the figures in Column D for comparisons with the US figures in Column A.
TABLE LATESTS DATA FROM THE US’s BJS AND THE AUSTRALIAN ABS SURVEYS
| Crime Victimization Rate (US name / Australian name; per 1,000 people, or households for Burglary) | US (BJS NCVS 2024) (A) | Australia (ABS CV Report 2023-24) (B) | Indicative repeat victimization multiplier (C) | Australia adjusted for repeat victimization (D) | Australia adjusted percent higher (E) |
| Total Assault / Physical assault + Threatened assault Face-to-face | 19.10 | 38.00 | 1.14 | 43.3 | 127 |
| Robbery | 2.20 | 2.00 | 1.33 | 2.7 | 21 |
| Rape/sexual assault / Sexual assault | 2.00 | 6.00 | 1.18 | 7.1 | 254 |
| Burglary / Break-in | 8.20 | 21.0 | 1.14 | 23.9 | 192 |
.
The age bases of the figures also differ, with the US NCVS including victims aged from 12 years and older, while the ABS figures are for victims 15 years and older and, in the case of sexual assault, 18 years and older. Australia’s physical assault figures may include more minor incidents.
.
The dramatically higher rates of violent crime victimization in Australia shown in the table above are consistent with the findings of the International Crime Victimization Survey, last completed in 2005, that ensured the same definitions were used and questions asked across countries. And the same age range was also covered.
.
There is another reason why the Australian crime numbers are biased downward relative to those in the United States. Violent crime victims more or less likely to answer telephone calls from strangers. It is precisely because of this concern that the National Crime Victimization Survey (NCVS) in the United States at least initially interviews people in person by the US Census. Once the person is in the sample, follow up calls can be by phone, but then follow up in person interviews can occur when people aren’t reached by phone. Each household stays in the sample for three years, being interviewed every six months. However, the Australian survey data is obtained solely by phone, not in person surveys, so to the extent a bias exists, it makes the Australian crime data look better relative to the NCVS data for the US.
.
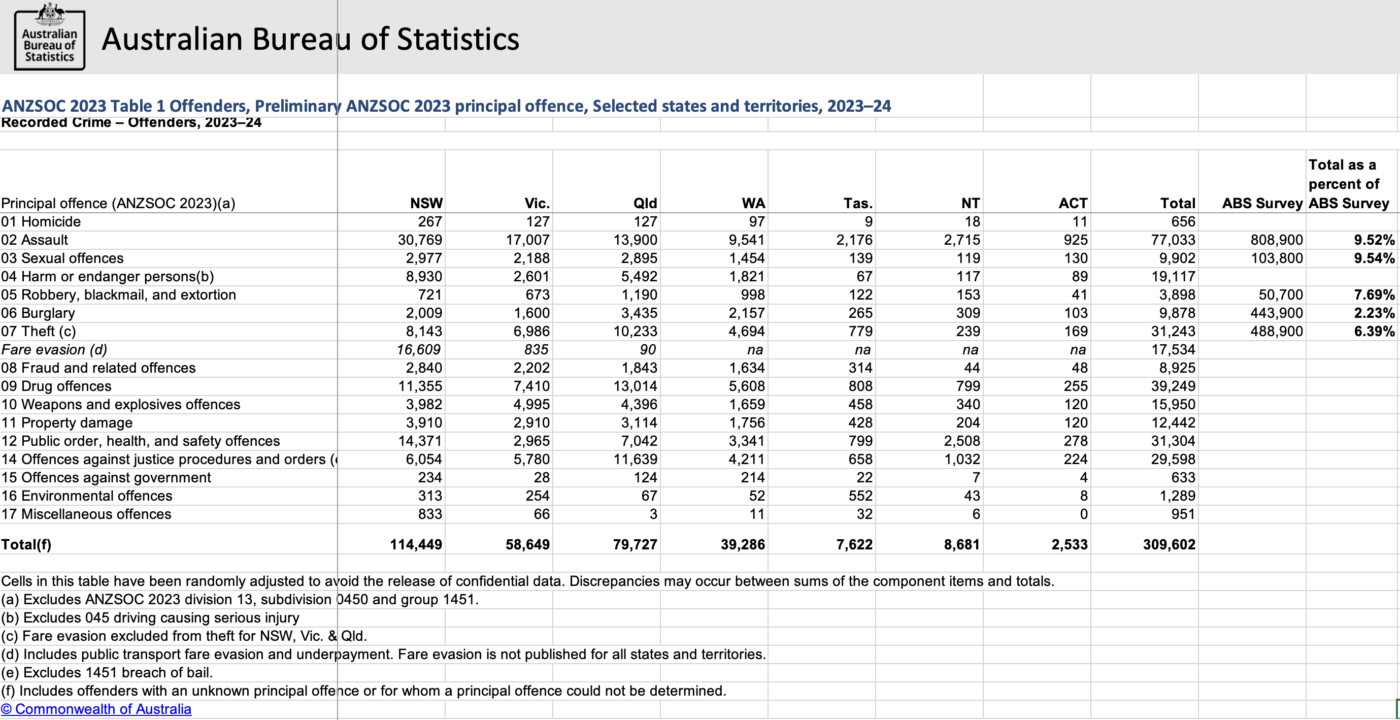
If you compare the total crimes reported to the police to the Australian Bureau of Statistics measure of total crimes, only about 9.5% of assaults (21.2% if it is just limited to ABS survey data on physical assaults), 9.5% of sexual assaults, 7.7% for robbery, 2.2% for burglary, and 6.4% for theft. The ABS survey itself finds different rates that people report crimes to the police: Physical assault 49%, Face-to-face threatened assault 39%, Sexual assault (adult) 19%, Break-in (burglary) 75%, Theft from a motor vehicle 51%, and Other theft (e.g., personal or household) 37%. Robbery isn’t clear. It is possible that crime victims in Australia are embarrassed to admit that they were victims of crimes and were unwilling to then report those crimes to the police. In any case, it is interesting that the Australian Bureau of Statistics doesn’t provide this alternative measure of the rate crimes are reported to police as they have both the actual number of reported crimes and their estimate of total crimes readily available. A gap between these two measures is also observed in US data, but the gap for Australia is especially large.
.
Information on the criminals and the victims is available here.


0 Comments