

Many graphs using the data are shown at the end of the post.
When another shooting happens at a place such as a school or a mall, politicians and the media are apt to claim that many hundreds of mass shootings occur each year. “Over the last year since Uvalde, our country has experienced a staggering 650 mass shootings,” President Joe Biden claimed in 2023. After the Madison, Wisconsin school shooting in mid-December, CNN said that “more than 500 mass shootings” had taken place so far in 2024.
These statements give an incorrect impression that there are massacres every day, like the infamous 2022 Uvalde shooting, which claimed the lives of nineteen students and two teachers, or the one in Lewiston, which claimed eighteen lives.
The numbers cited by Biden and CNN come from the Gun Violence Archive, which broadly defines mass shootings to include any case with four or more people shot or injured. The injuries could occur in the course of running away, and not from actually being shot. It is also useful to note that the GVA is a gun control group. Mark Bryant, who runs the Gun Violence Archive (GVA), lobbied the CDC to remove data on defensive gun uses from their website on the rate of defensive gun uses because that information “has been used so often to stop [gun control] legislation.”
There is a reason that Uvalde got the news coverage it did, and you don’t hear about these other hundreds of cases. What makes these attacks newsworthy is that the shooter tries to kill as many innocent people as possible in a public place. The FBI active shooting reports concentrate on shootings that occur in public and do not involve some other crime, such as drug gang fights or robbery. Traditionally, the FBI has classified “mass” as four or more people being murdered. Academic studies have used a similar definition. We are using this definition (more details are available here).
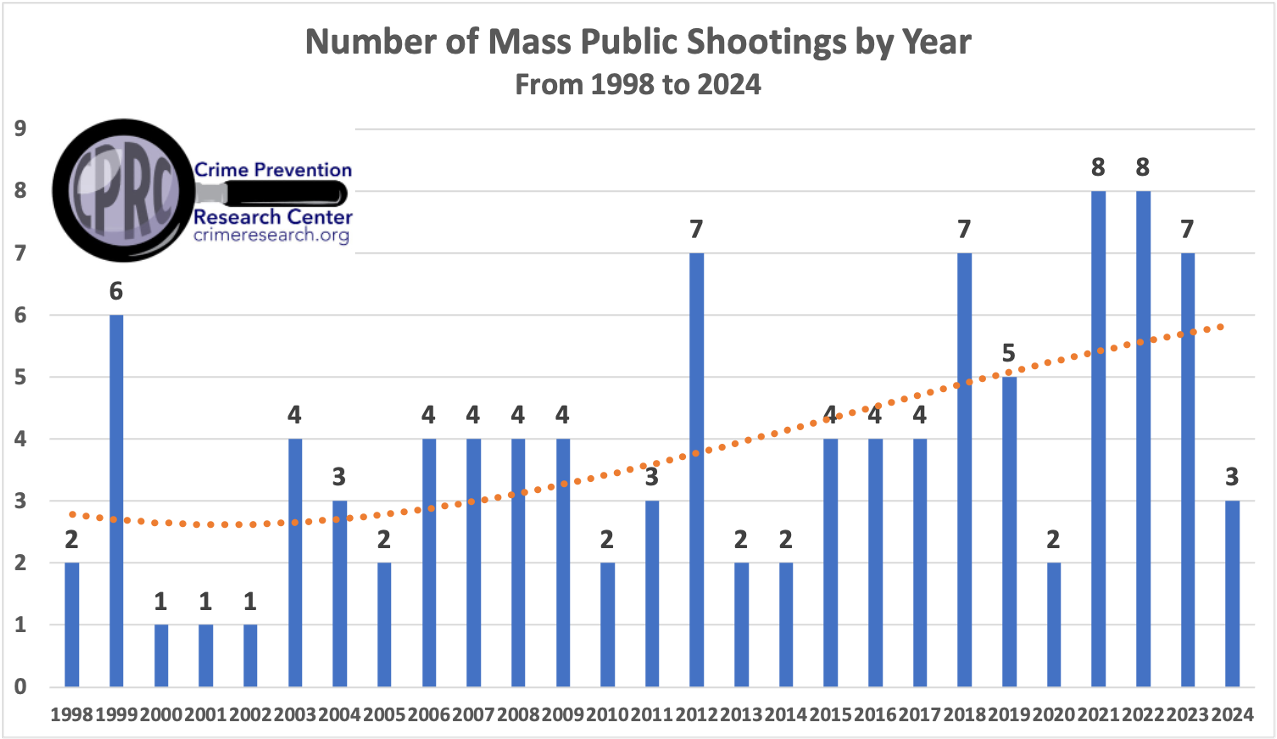
Since 1998, there have been between one and eight of these mass public shootings a year, with the two years when there were eight of them occurring during the Biden administration. During the Trump administration, there was an average of 4.5 attacks a year compared to 6.5 during Biden.
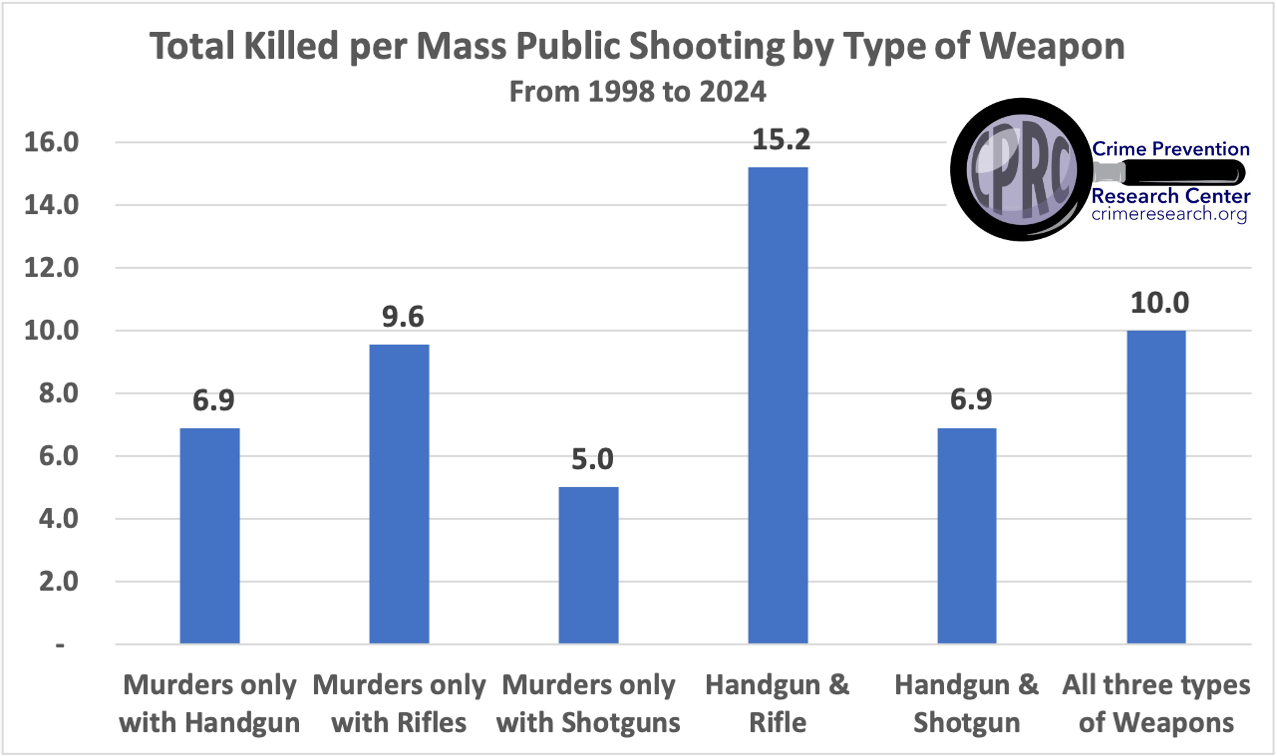
Between January 1st, 1998, and December 16, 2024, 51.9% of attacks used solely handguns, and 17.3% used only rifles of any type—35.6% of attacks used solely rifles or rifles in conjunction with another type of gun. Given the debate over pistol-stabilizing braces, the Excel file we provide lists the guns used in each attack, and two of the attacks used AR-15-type handguns with a pistol-stabilizing brace. (More information is available here. Here is our research on the rate at which any type of rifle is used in murders.) In discussing Klarevas’ research, we have also previously examined the rate at which assault weapons have been used over time before, during, and after the federal assault weapons ban (the Excel file with the data is available here).
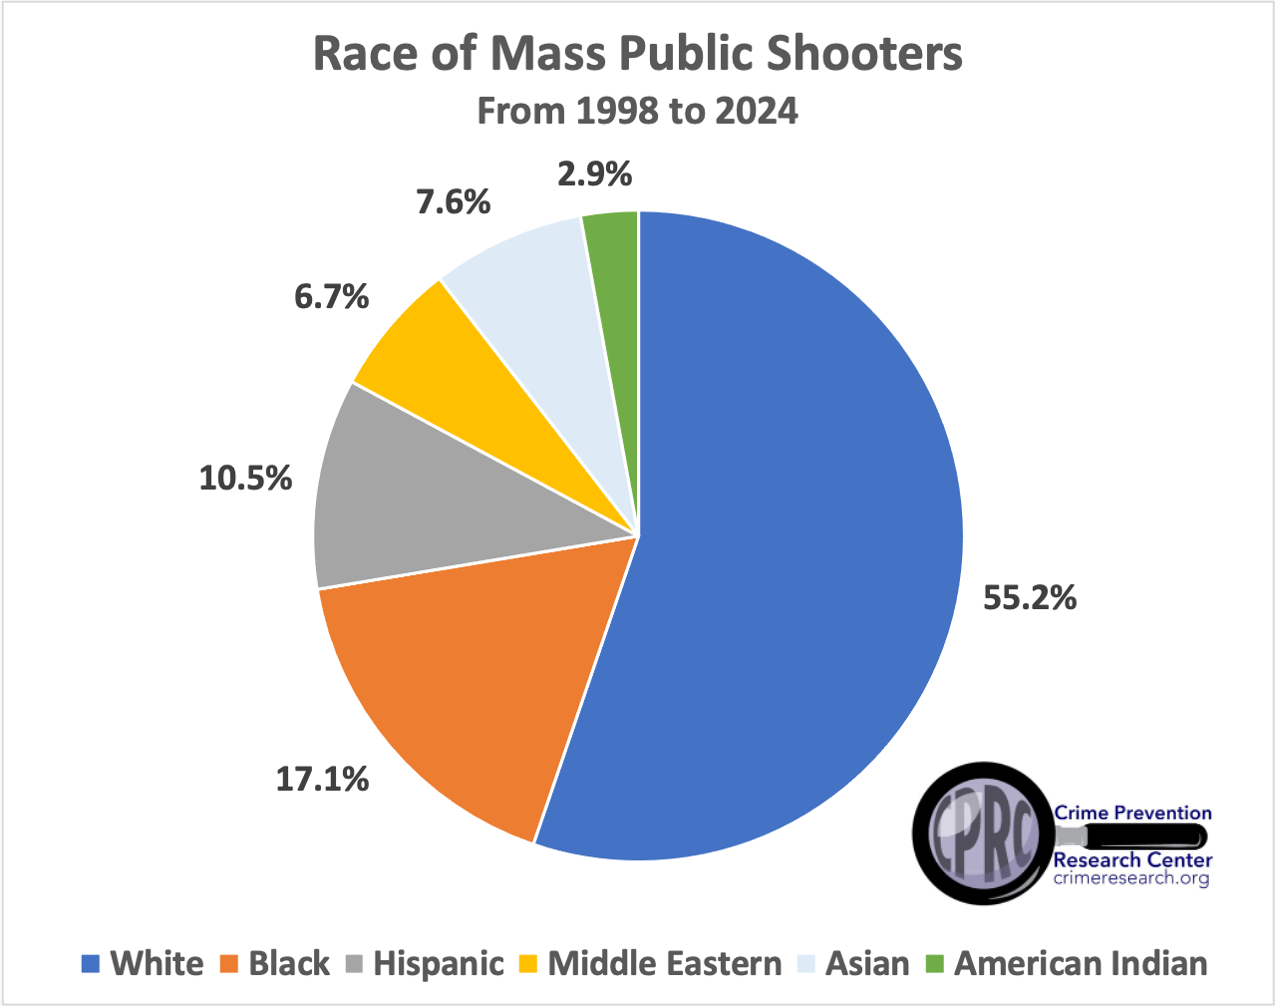
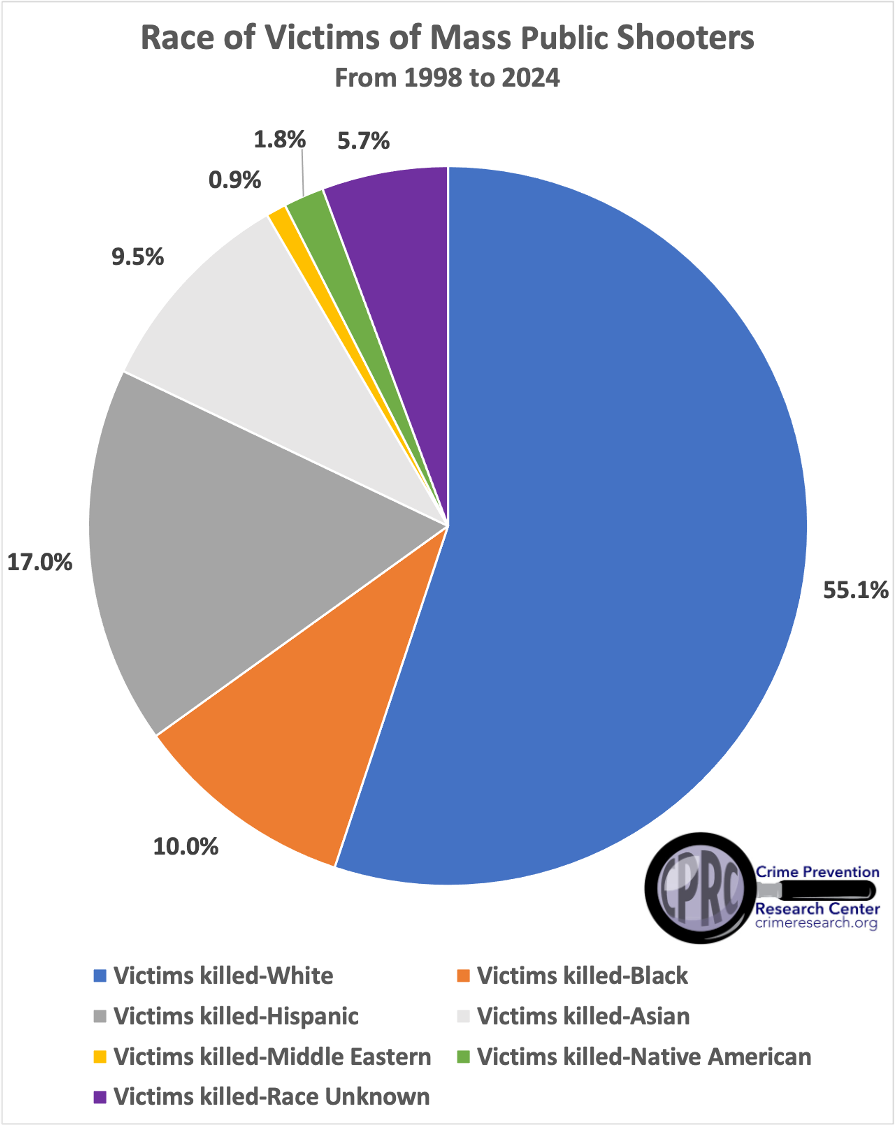
58.4% of the US population was non-Hispanic white in 2024, with 1.06% being Middle Eastern and North African (MENA), so about 57.2% are non-Middle Eastern whites. With 55% of the murderers and victims being non-Middle Eastern whites, whites are slightly below their share of those involved in these attacks.
With all the discussions about the racial motives of shooters, blacks are underrepresented as a share of the victims. Blacks comprise 17.1% of the murderers but only 10.0% of the victims. That 10.0% is less than their 13.7% of the general population.
Hispanics are underrepresented as a share of mass murderers. 10.5% of these mass murderers are Hispanic compared to Hispanics, making up 19.5% of the general population. But their 17.0% share of the victims is close to Hispanics’ share of the general population.
Compared to Middle Easterners at 1.06% of the general population, they are overrepresented as a share of mass murderers (6.7%) and slightly underrepresented in terms of victims (0.9%).
Asians make up 6.4% of the population, but they are overrepresented in both mass murderers (7.6%) and even more overrepresented as victims (9.5%). Interestingly, 51.2% of the Asians murdered in these attacks were murdered by other Asians.
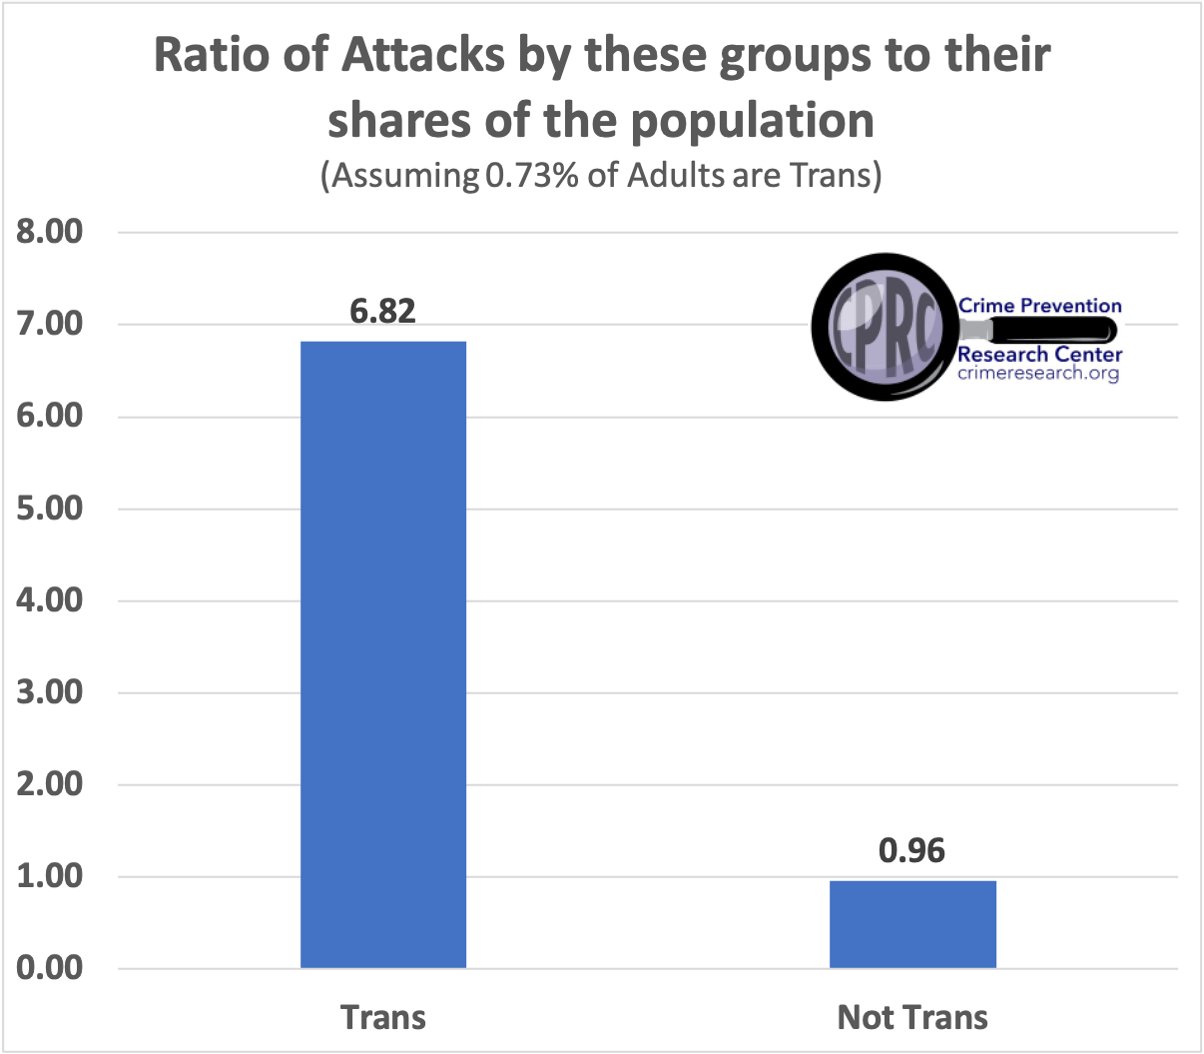
Trans individuals are well over-represented in terms of attacks. There are three estimates of the percentage of adults who are trans (CDC’s Behavior Risk Factor Surveillance System (BRFSS) and Youth Risk Behavior Survey (YRBS) finds 0.5% between 2017 to 2020, Gallup shows 0.7% in 2021, and the Census puts it at 1% in 2023). These numbers are clearly increasing over time, so an average for 2018 to 2023 years would probably overestimate the rate, but the average is 0.73%. Trans share of mass public shootings over the 2018 to 2024 period is 6.8 times their share of the population. The Nashville Catholic School shooter in 2023 and the Club Q murderer who identified as nonbinary and used the pronouns they and them in 2022 were transgender individuals.
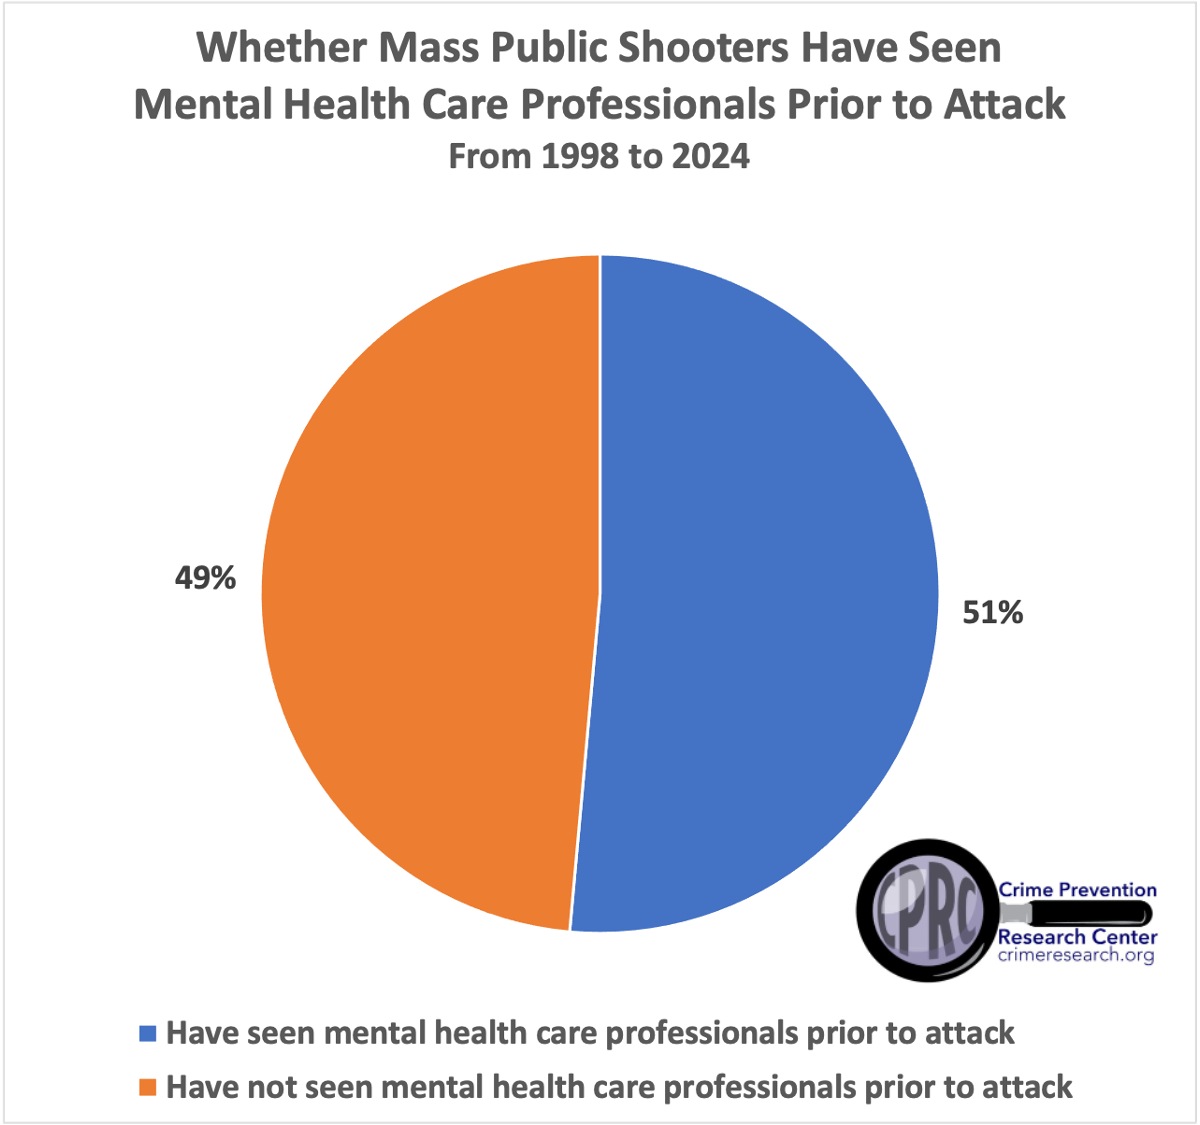
From January 1st, 1998, to December 31, 2024, 51% of mass murderers have seen mental health care professionals before their attacks.
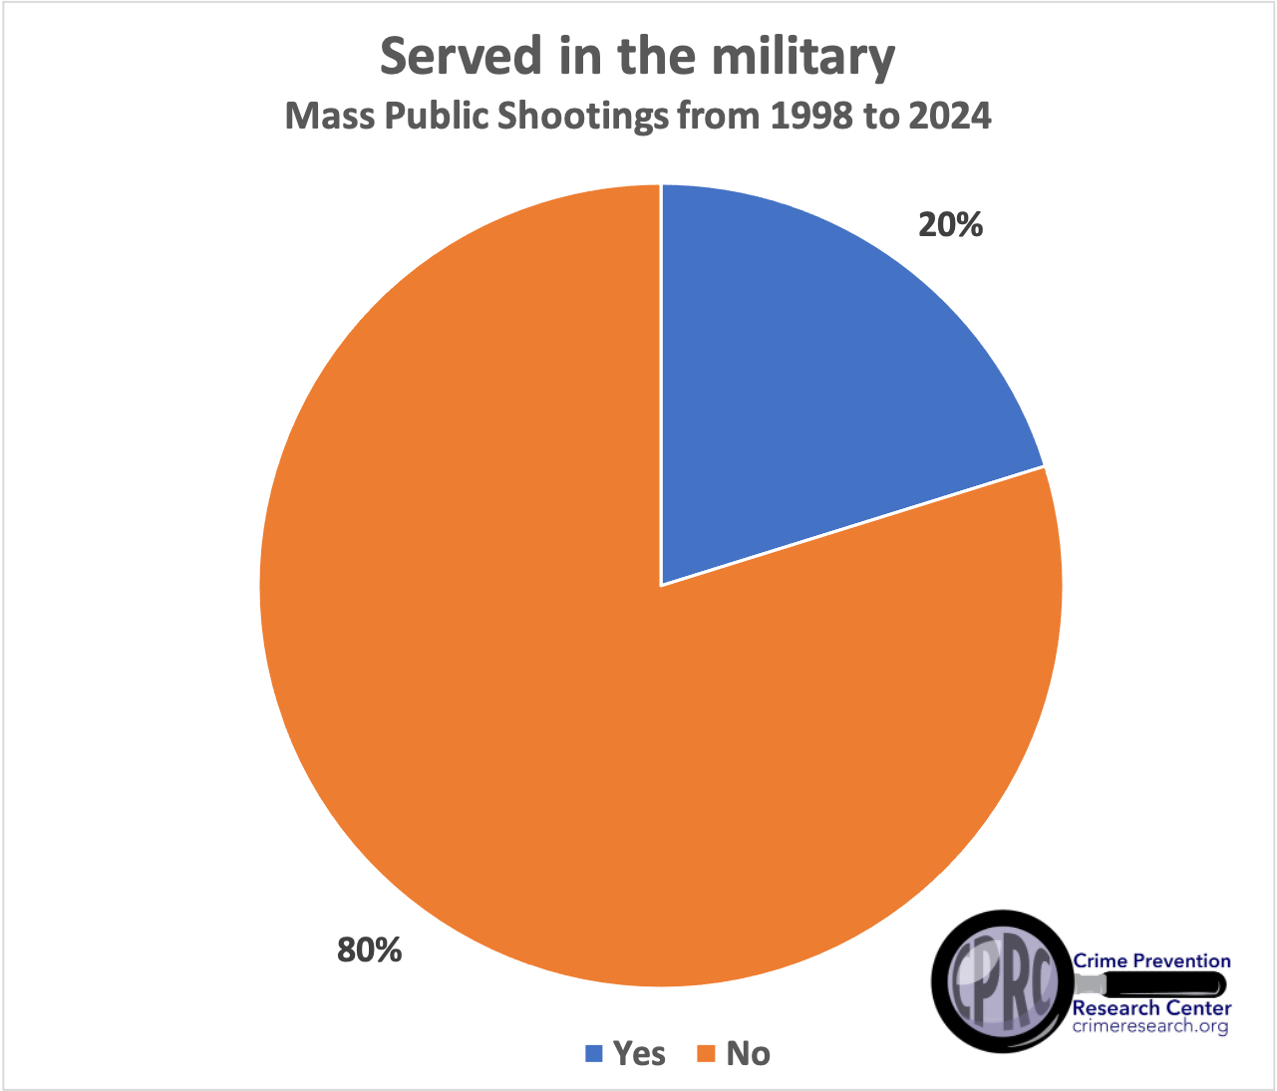
In 2023, about 6.1% of the US were veterans, but almost 20% of mass public shooters over the 1998 through 2024 period were veterans.
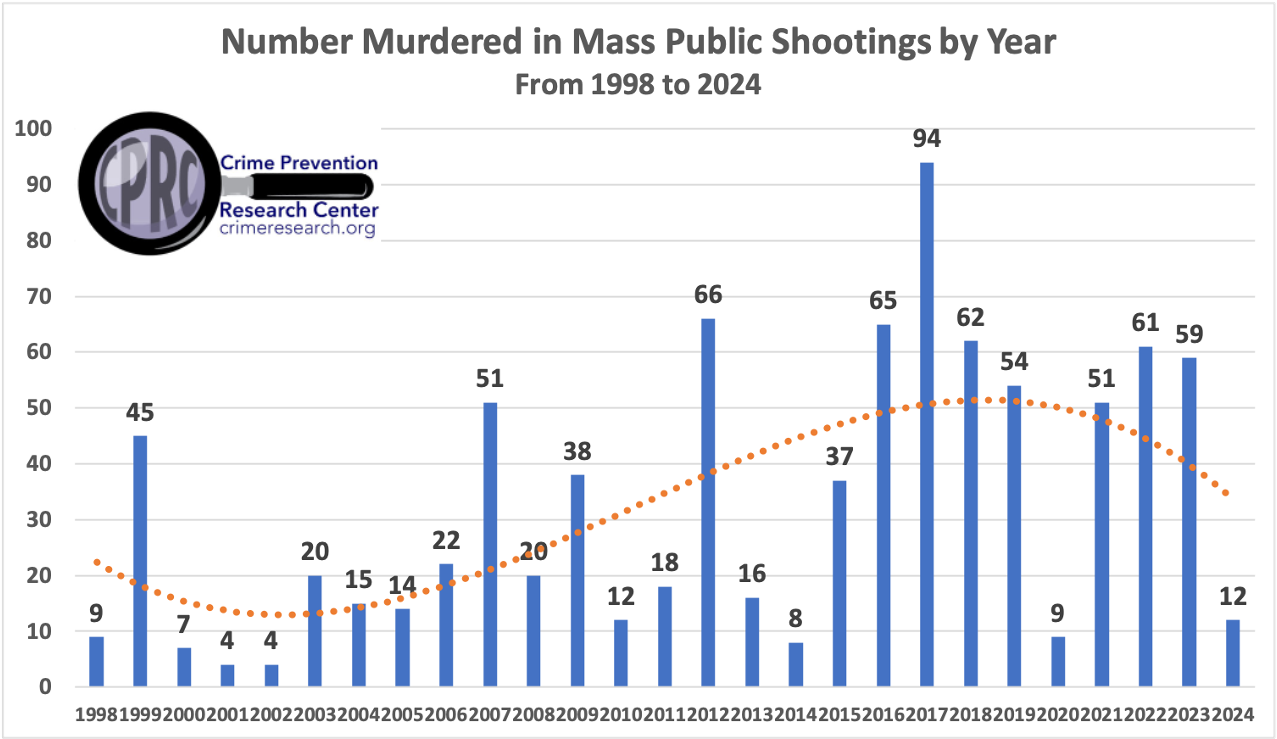
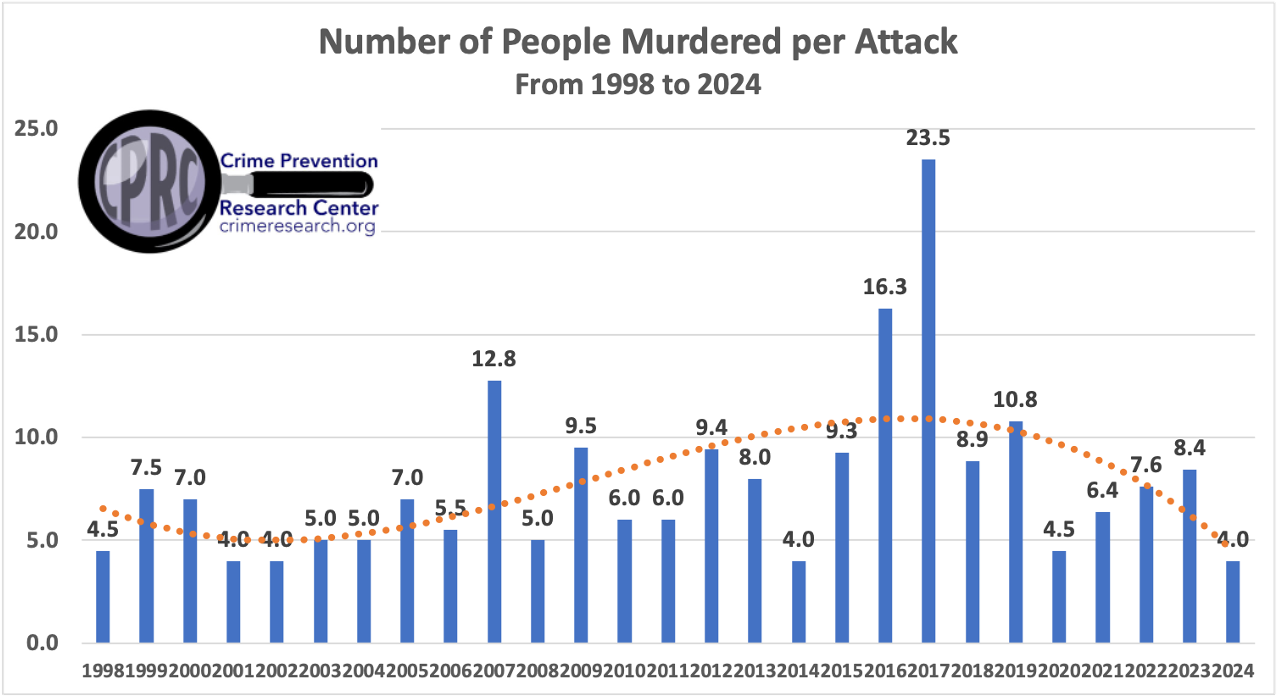
Between 1998 and 2024, the number of mass public shootings averaged 3.9 attacks, 32.3 murdered per year, and the number murdered per attack was 7.8. The number of attacks is increasing at an increasing rate, while the number of people murdered and the number murdered per attack is declining. In five-year intervals, the number of mass public shootings varied this way: 2.0 (2000-2004), 3.6 (2005-2009), 3.2 (2010-2014), 4.8 (2015-2019), and 5.6 (2020-2024). In five-year intervals, the number of people murdered in mass public shootings varied this way: 10 (2000-2004), 29 (2005-2009), 24 (2010-2014), 62.4 (2015-2019), and 38.4 (2020-2024).
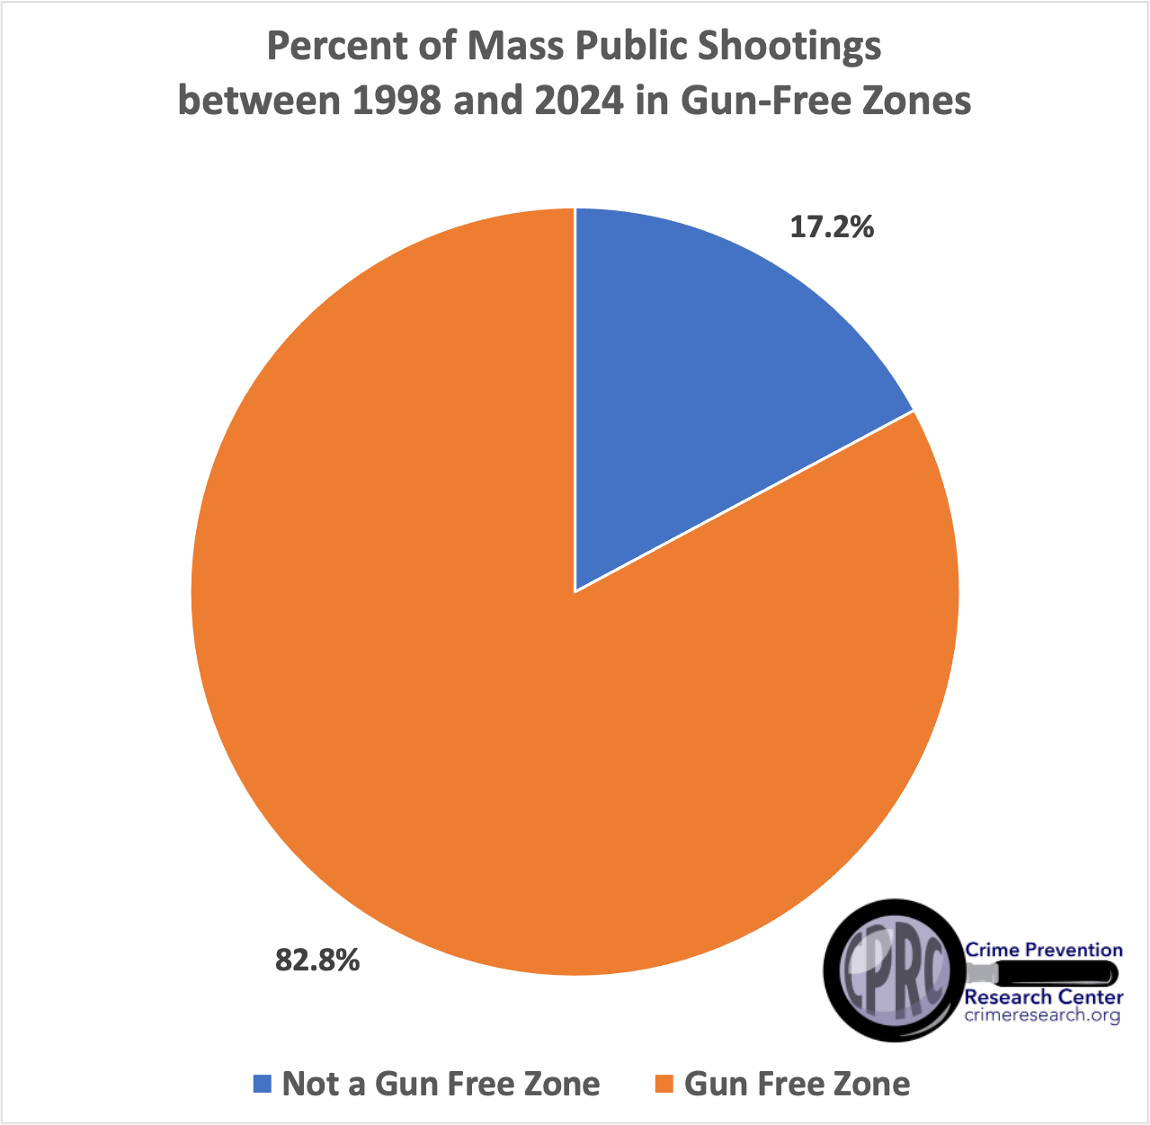
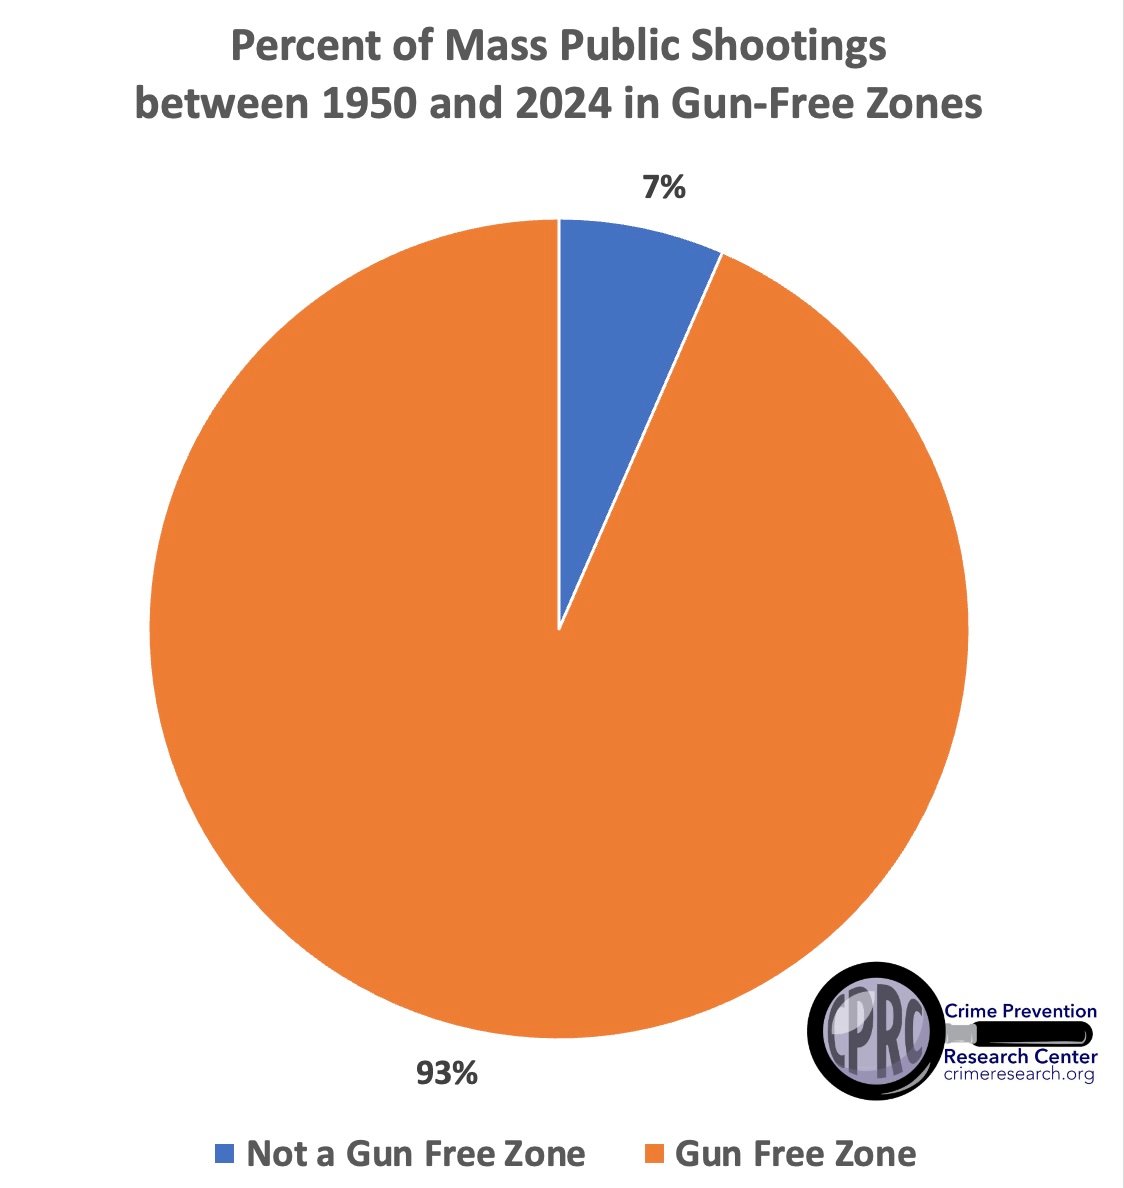
82.8 percent of the attacks since 1998 and 94 percent since 1950 have occurred in places where guns are banned. For those who read these murderers’ diaries or manifestos, these numbers aren’t too surprising. These mass murderers plan their attacks long in advance (at least six months). Their goal is to get media attention, and they know that the more people they kill, the more media attention they get. They know if they attack a place where people can’t defend themselves, they will be able to kill more people.
For a more complete discussion on the definition of mass public shootings and gun-free zones and data going back to 1950 see the discussion here. That shows 93% of mass public shootings occur in gun-free zones versus the 83% from 1998 to 2024.
There is a distinction between civilians and police being able to stop mass public shootings. Uniformed, easily identifiable individuals find themselves at a serious disadvantage in an attack.
“A deputy in uniform has a difficult job in stopping these attacks,” noted Sheriff Kurt Hoffman in Sarasota County, Florida. “These terrorists have strategic advantages in determining the time and place of attacks. They can wait for a deputy to leave the area or pick an undefended location. Even when police or deputies are in the right place at the right time, those in uniform who can be readily identified as guards may as well be holding up neon signs saying, ‘Shoot me first.’ My deputies know that we cannot be everywhere.”
Whether one looks at the pre or post 1998 period there is a very high rate of mass public shootings occurring in gun-free zones.
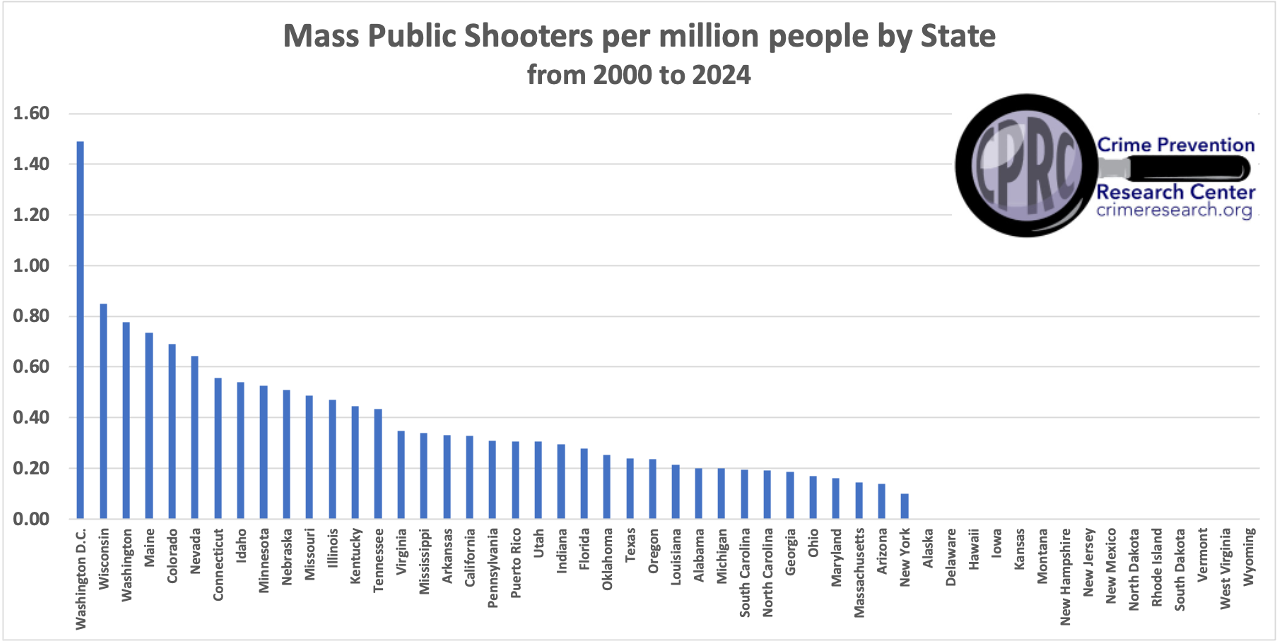
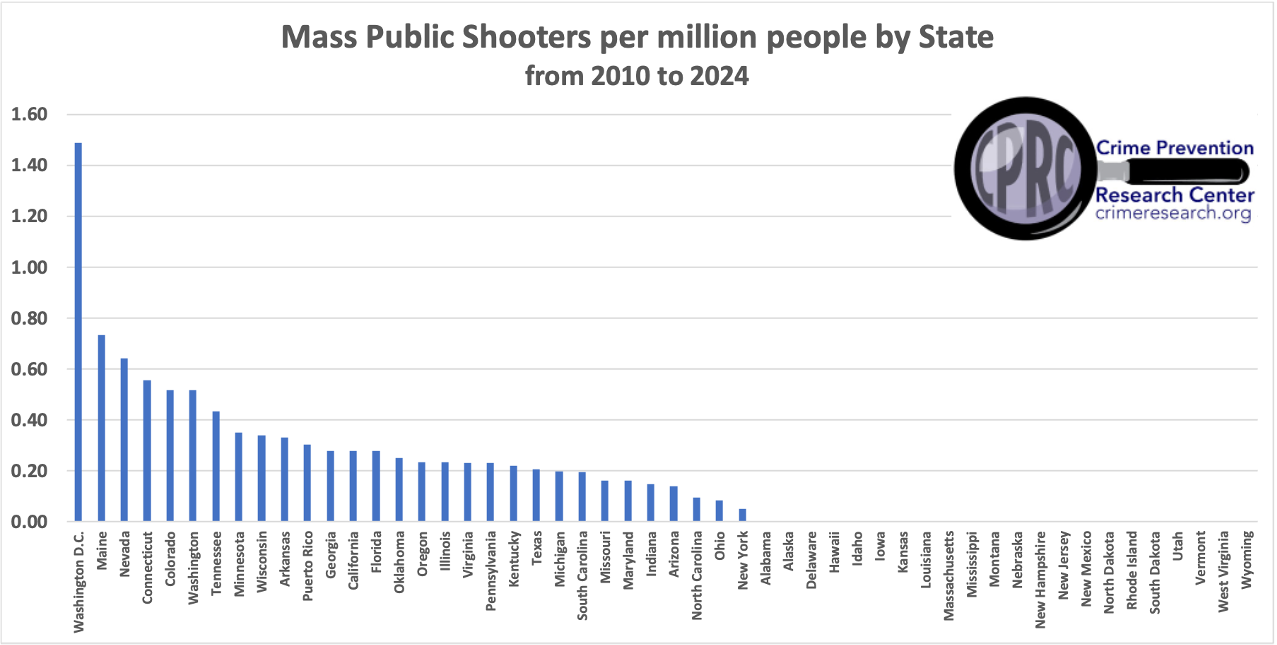
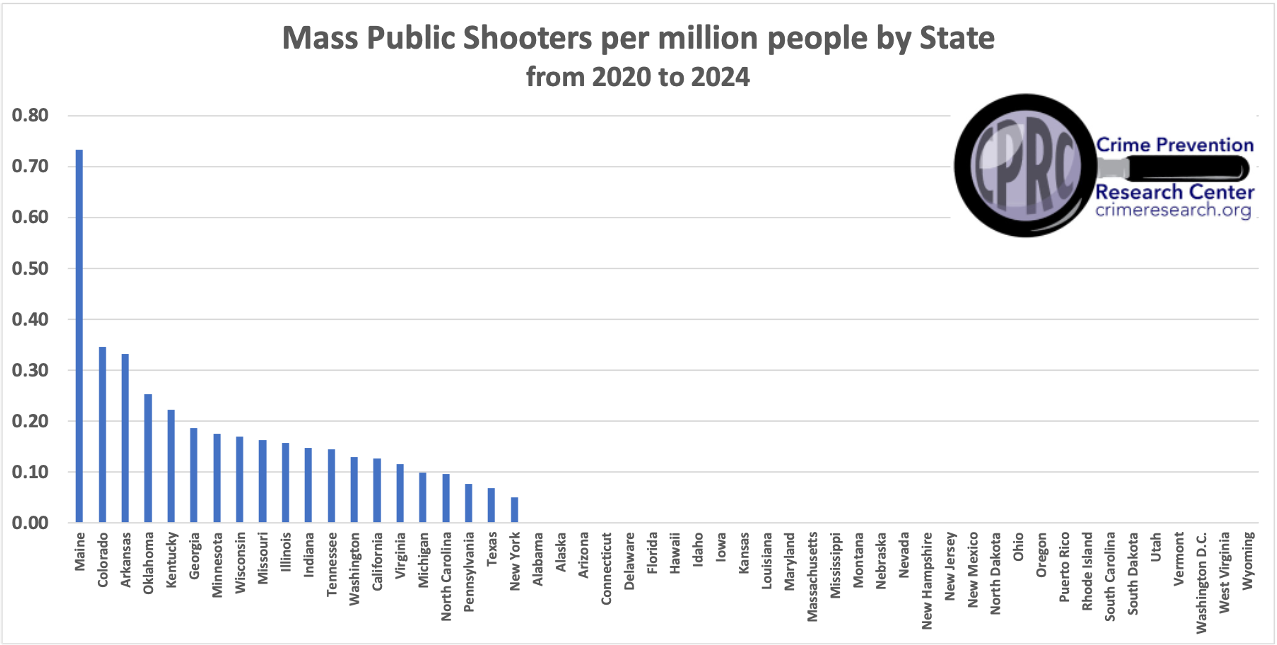
The final set of figures shows how California’s per capita rate of Mass Public Shootings is much higher than the rate for the rest of the country. Since 2000, California’s rate has been 0.33 per million, and for the rest of the US, it has been 0.28. Since 2010, California’s rate is 0.28 per million and 0.19 for the rest of the US. Since 2020, it has been 0.13 for California and 0.07 for the rest of the US.
We will also note that there are only two of the mass public shootings that used suppressors: the Virginia Beach attack in 2019 and the Milwaukee attack in 2020. The average number of casualties from mass public shootings with suppressors is actually lower than the average without (11 v. 19.8), though the average number of people murdered is exactly the same as (8.5 v. 8.5).There were 102 cases without a suppressor, compared to two with them. But in the two cases where suppressors were used, two guns were used in both cases and only one of the guns used a suppressor.
Mass Public shooters with documented schizophrenia diagnosis.
Michael McDermott, Dec 26, 2000 – Wakefield, MA (Edgewater Technology) — diagnosed paranoid schizophrenia.
Nathan Gale, Dec 8, 2004 – Columbus, OH (Alrosa Villa nightclub): — mother reported the Marines had diagnosed him with paranoid schizophrenia (family statement reported by AP/CBS). This case might be excluded as the diagnose was reported only by family rather than in court/medical records.
Eduardo Sencion, Sep 6, 2011 – Carson City, NV (IHOP): — diagnosed paranoid schizophrenia
Jared Loughner, Jan 8, 2011 – Tucson, AZ (Safeway) — diagnosed schizophrenia (per prosecutors/court proceedings).
One L. Goh, Apr 2, 2012 – Oakland, CA (Oikos University) — diagnosed paranoid schizophrenia; found incompetent and committed to Napa State Hospital, later tried/convicted
Esteban Santiago, Jan 6, 2017 – Fort Lauderdale, FL (Airport) — diagnosed schizophrenia in federal case filings/hearings.
Travis Reinking, Apr 22, 2018 – Nashville, TN (Waffle House) — schizophrenia; case paused for treatment; defense and court records referenced diagnosis
Ahmad Al Aliwi Alissa (Boulder, CO — March 22, 2021)
Other information.
Nashville Covenant School Shooting Report
Excel File with Data


Thank you did keeping updated numbers published.
Thank you for publishing objective, non-political numbers. Keep up the good work.
John,
Can you help me understand the data. You show 3 mass shootings in 2024 with 12 killed. Wikipedia shows 21 mass shootings with a total of 68 killed and 143 injured. What am I not understanding about these two very different #s?
Our definition follows the traditional FBI definition of four or more killed in a public place that is not part of some other crime like a gang fight over drug turf or a robbery.
Thank you! You do great work and we appreciate your efforts.
Thank you very much.