
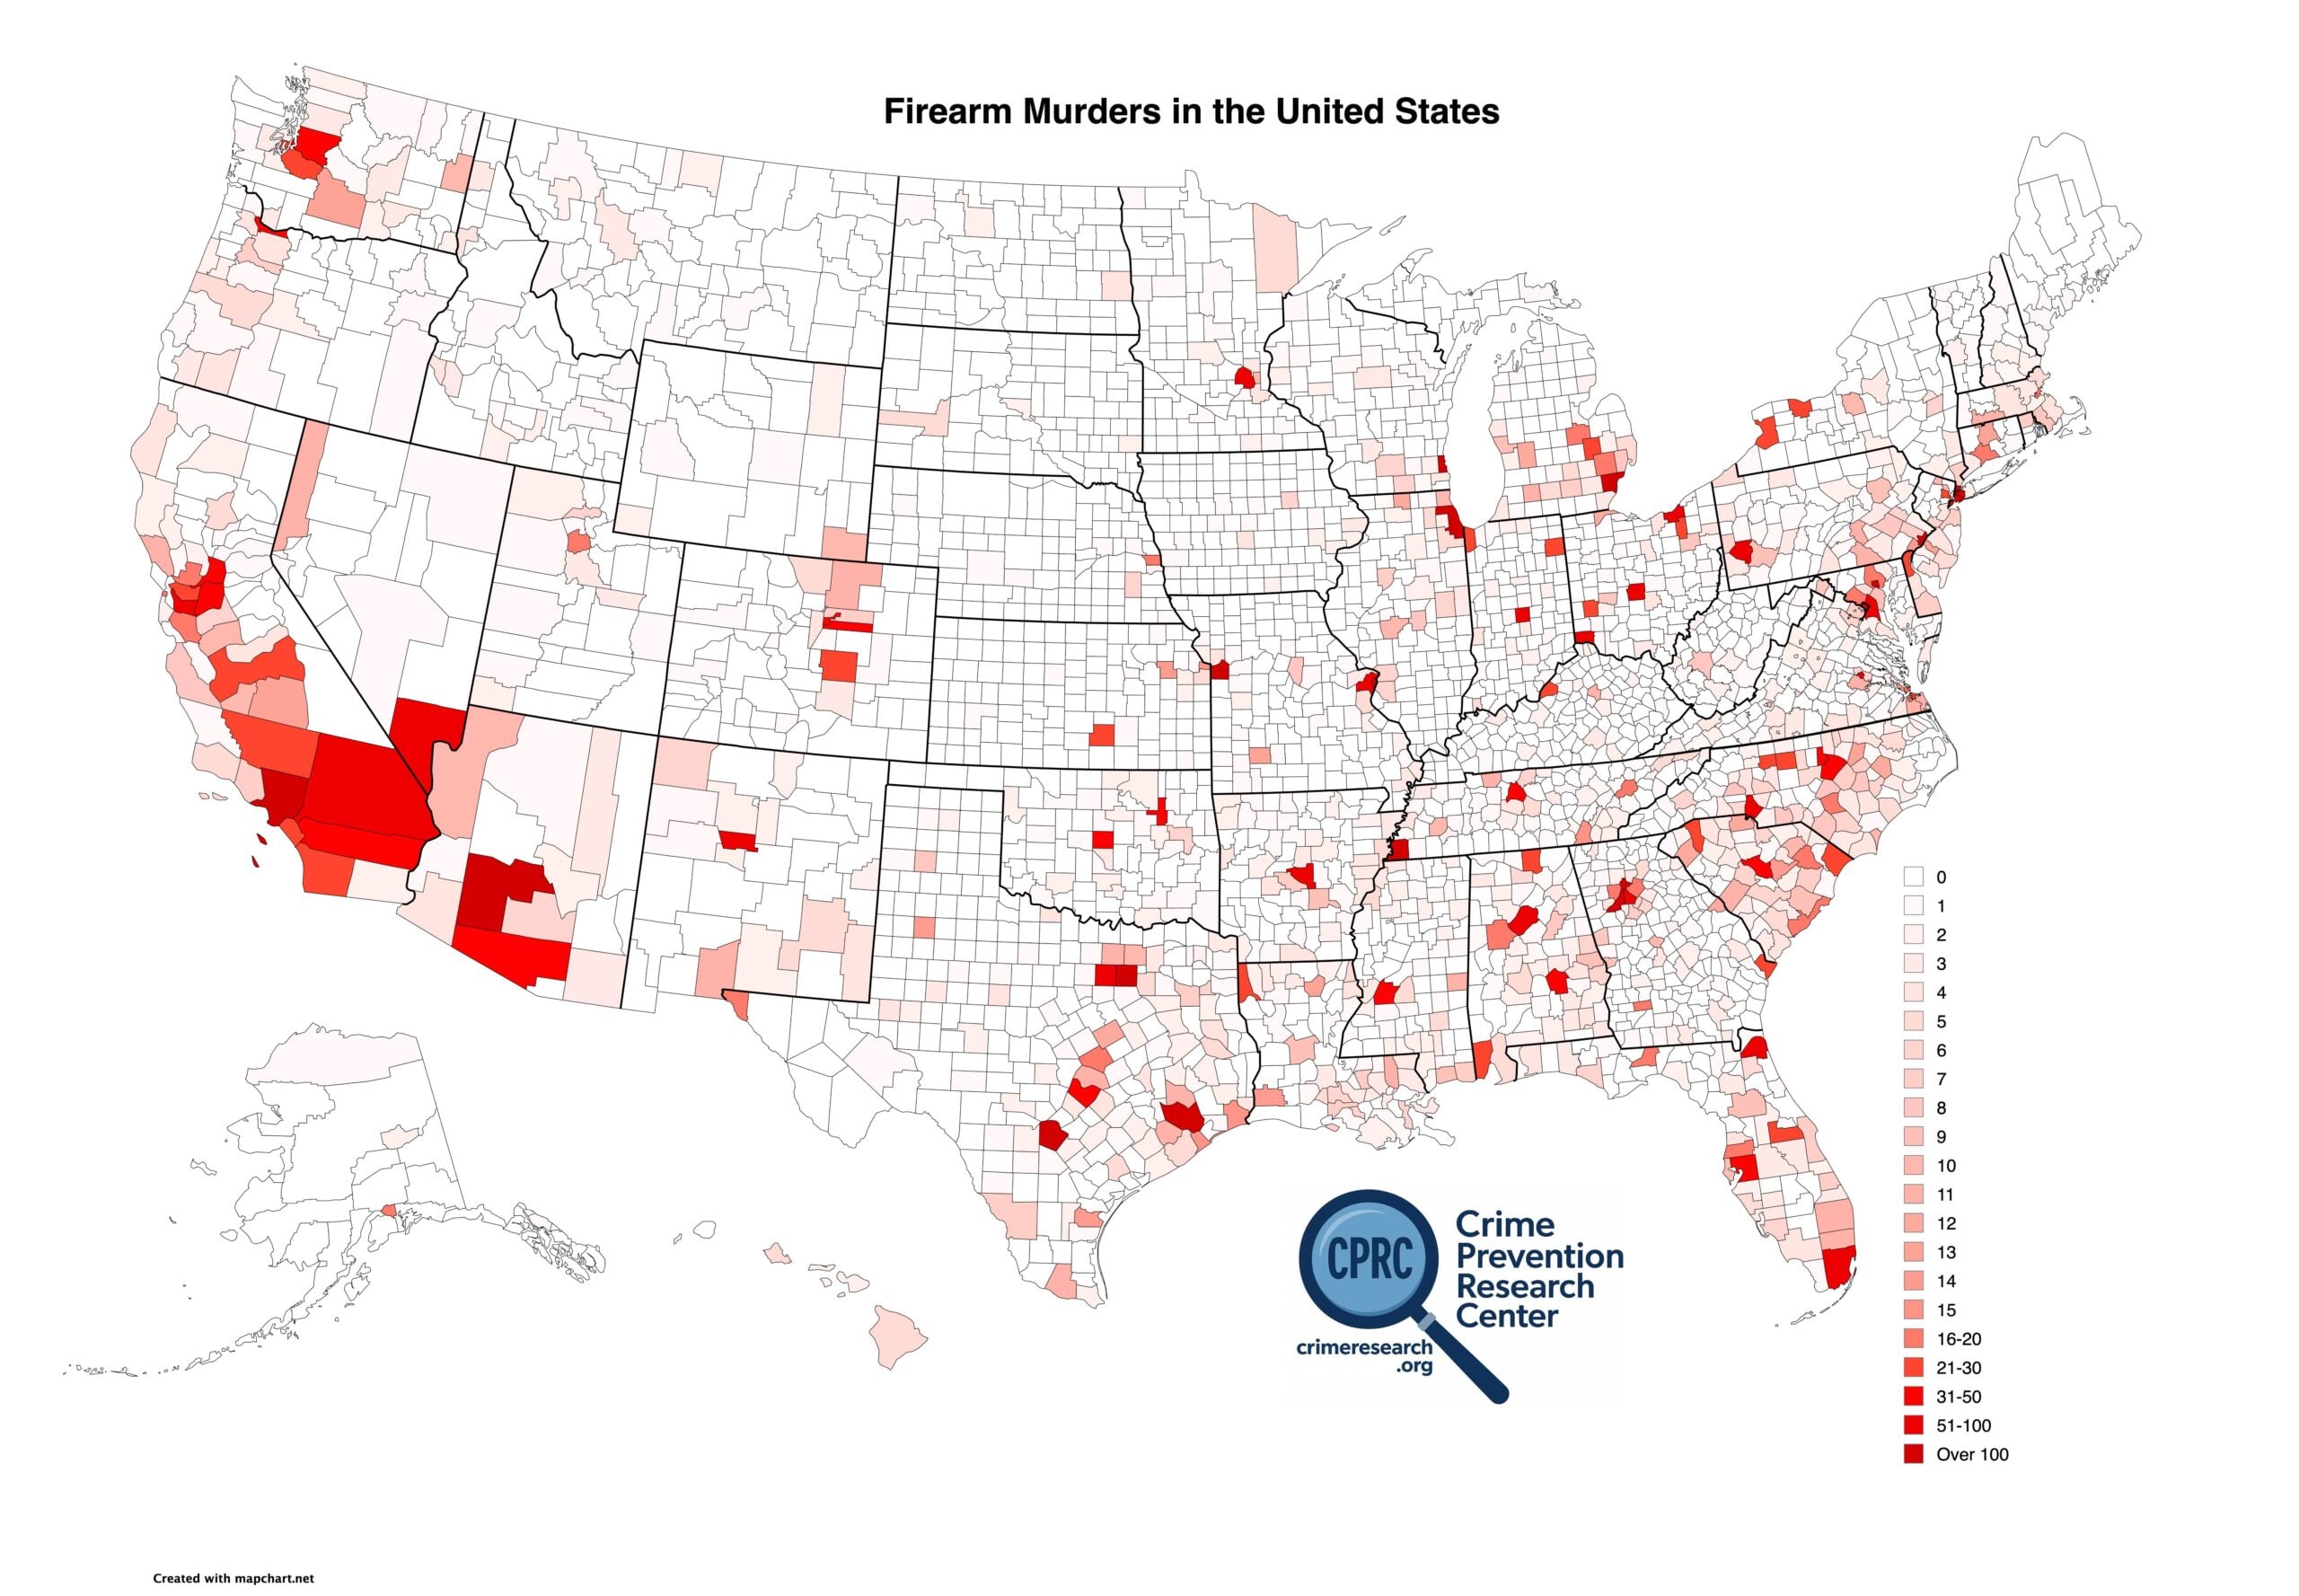
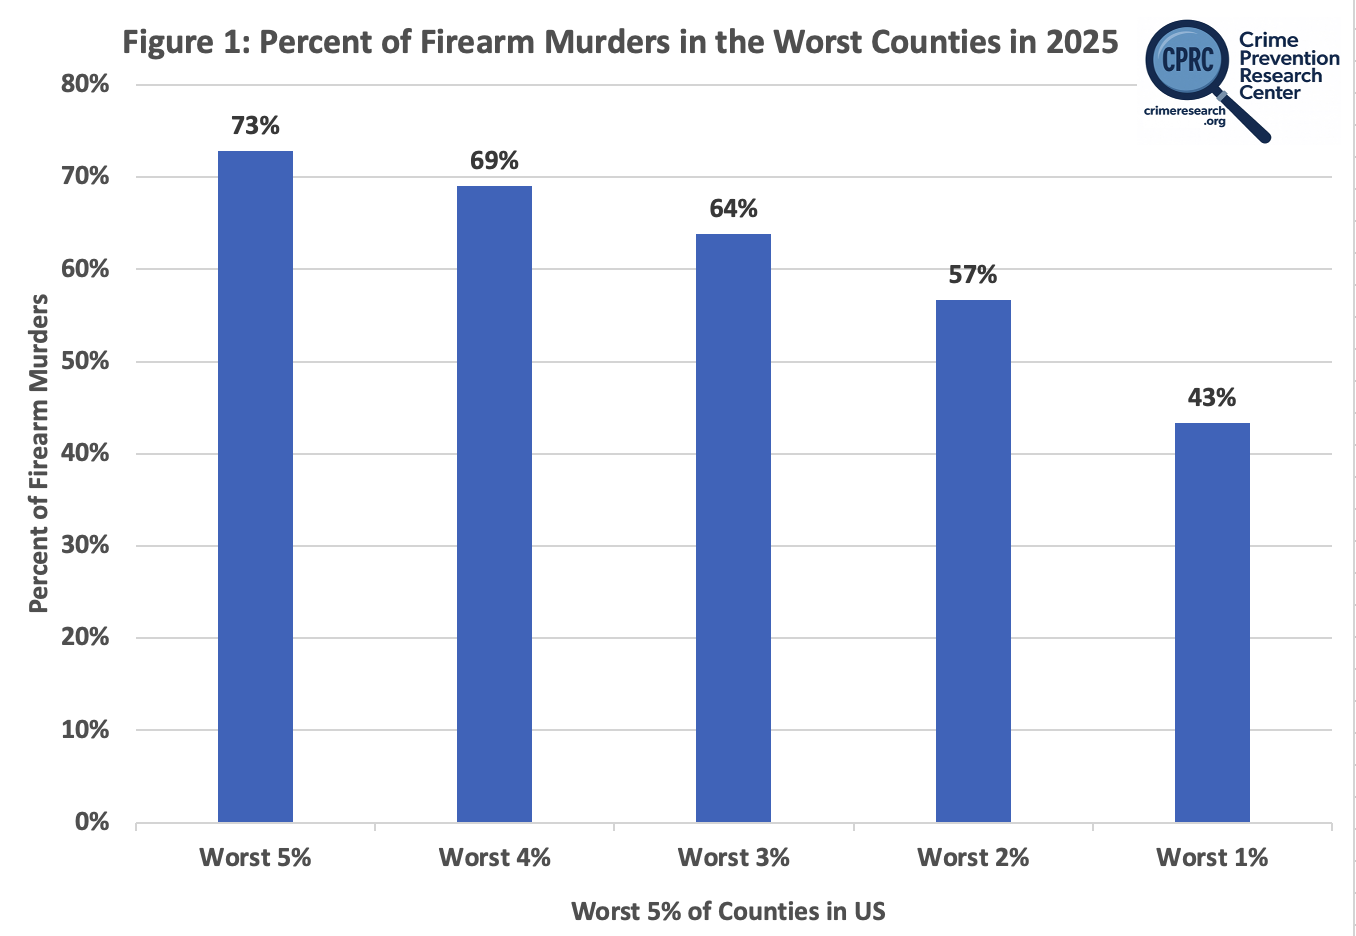
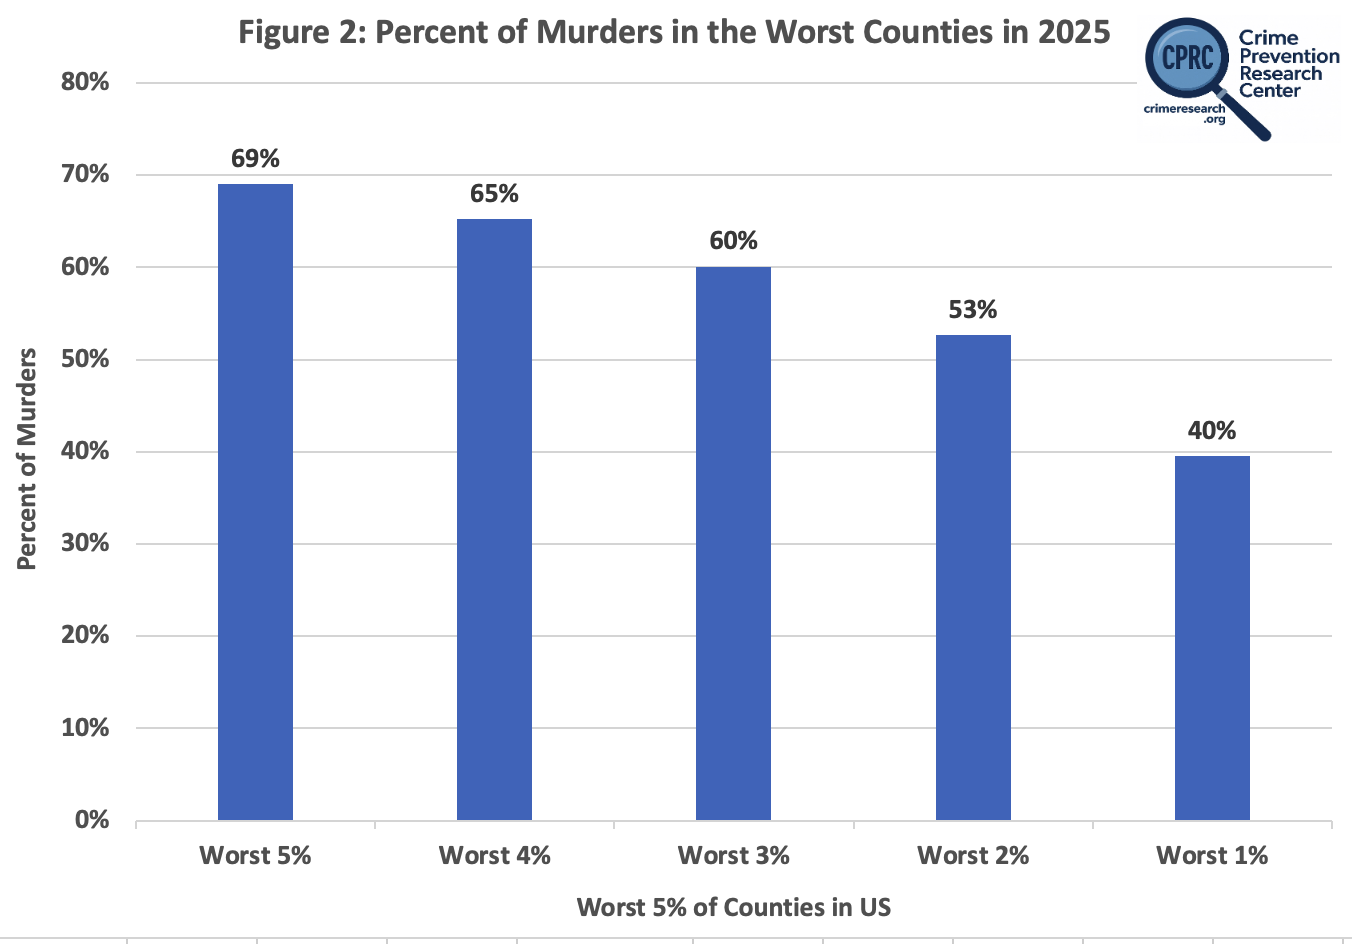
We have previously examined how heavily murders concentrate in the United States, but this is our first analysis of firearm homicide concentration. The first two graphs show that the worst 2% to 5% of counties account for a share of firearm murders about four percentage points larger than their share of all murders. Firearm murders are more concentrated than all murders.
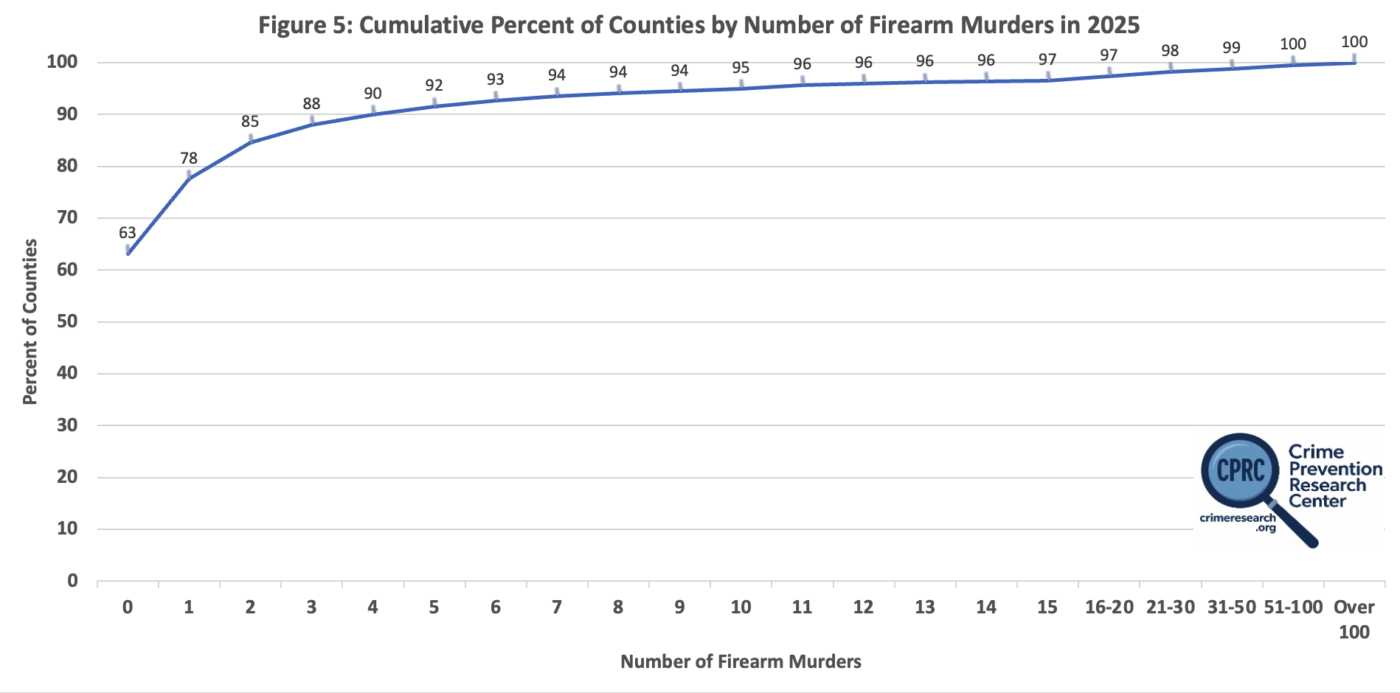
Another way to see this concentration: 1,981 counties with 17% of the population recorded no firearm murders, and another 453 with 8.92% of the population recorded just one. Together, 78% of counties recorded zero or one firearm murder. So just 4.9% of the firearm murders occurred where 25.97% of the people live.
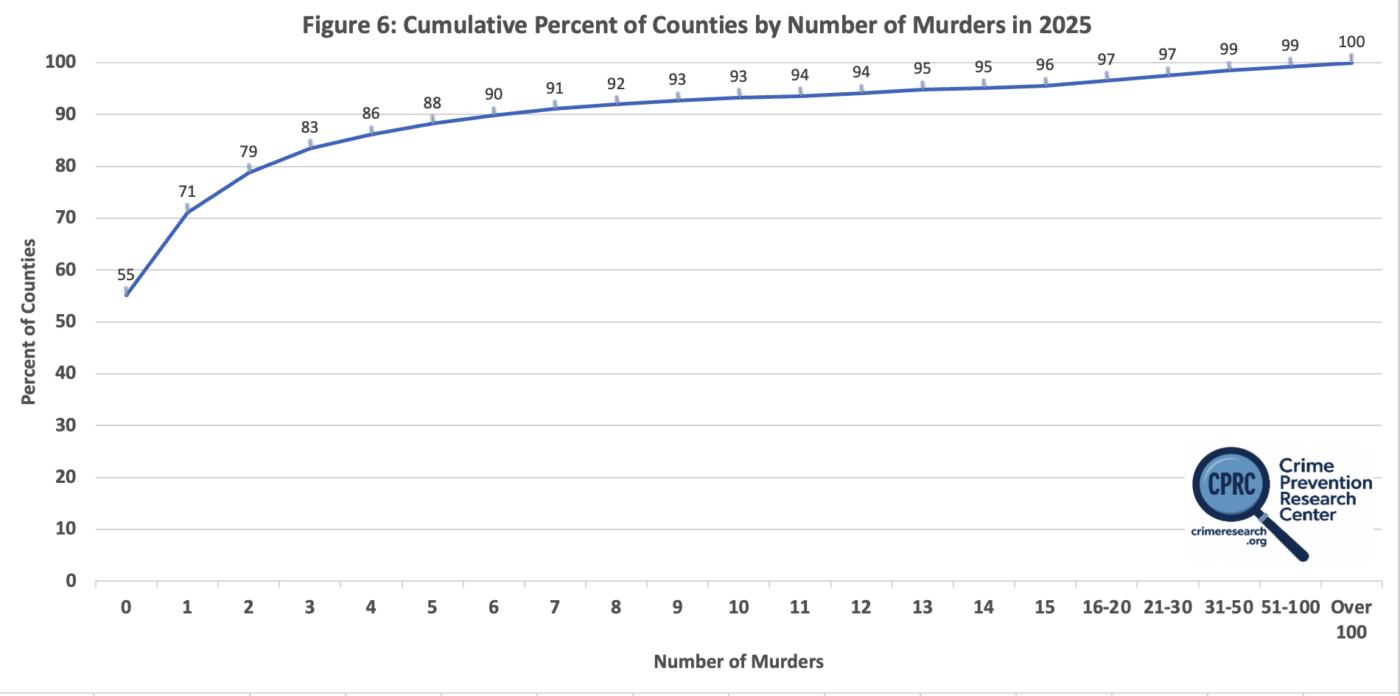
By comparison, 1,729 counties recorded no murders of any kind, and another 503 recorded just one—a total of 71% of counties. Counties with zero or one murder contained 19.7% of the population—12.2% in counties with no murders and 7.51% in counties with one—but accounted for only 3.9% of all murders.
There was a total of 9,288 firearm murders and 12,768 murders in 2025. The data is available here (the Excel files we created using that data are provided here for the firearms murder data and here for the overall murder data).
This report marks our first analysis of firearm murder concentration. The share of counties recording zero or one murder rose slightly, from 69% in our 2024 report to 71% in 2025. In 2025, the counties with either zero or one firearm murder or murder accounted for just 4.9% of firearm murders and 3.9% of all murders.
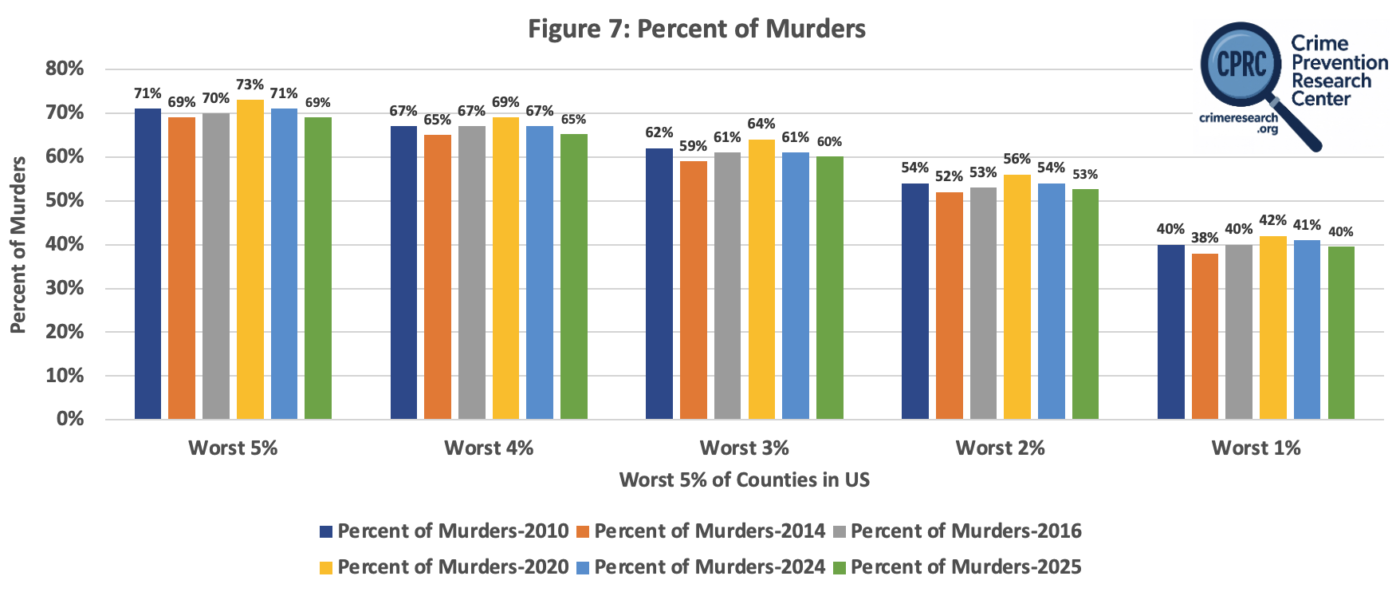
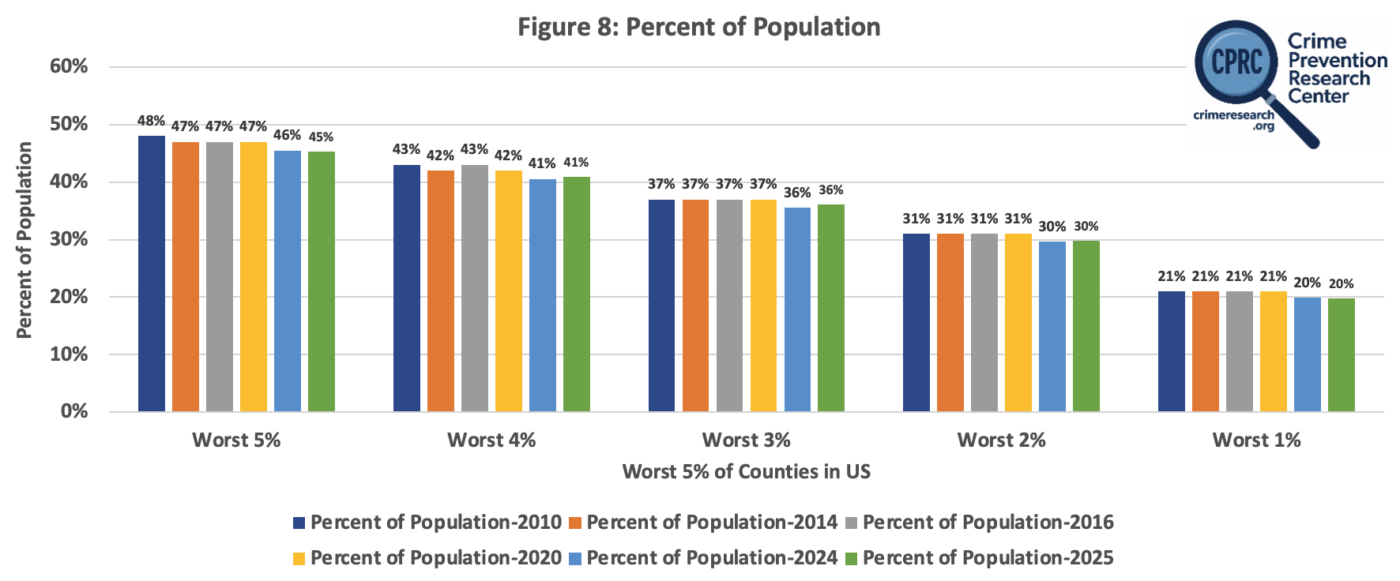
Meanwhile, the counties with the most murders accounted for slightly smaller shares of the national total. The worst 1% of counties accounted for 40% of murders in 2025, down from 41% in 2024, with them having 20% of the U.S. population in both years. The worst 2% accounted for 53%, down from 54% (and they have 30% of the population). As the murder rate plunged to record lows in 2025, murders fell proportionately faster in the counties that had the most murders. In our past work, we have shown how even within these counties with the most murders, the murders are even extremely concentrated in tiny areas within those counties (here and here).
As we show at the end, Biden carried all but one of these counties in 2020. Trump carried the lone exception by just 1.1 percentage points. Even in the more Republican 2024 election, Harris carried 25 of these 31 counties. Trump carried the other six by an average of only four percentage points.
More importantly, murders in these counties overwhelmingly occur in their major cities, where city officials make key policing decisions. Excluding the places where the cities and the counties cover identical areas, for the 1% of the counties where the most murders occur, on average 74% of the murders in those counties occur within their major city (see Table 7 at the end). Where the major city does not encompass the entire county, the city consistently votes more Democratic than the county as a whole. In 2024, Harris carried the major city in all six of the six counties that Trump won (Table 8). Twenty-six of the 31 cities elected Democrats as mayors and either had a strong Democrat majority or Democrat-leaning control of the city councils (Table 9). Miami and San Bernardino have Democratic mayors and officially nonpartisan councils with no documented party majority, so it is possible that total is 28 rather than 26 (see the list at the end). There is only one clear case where there is a Republican mayor and Republican city council — Oklahoma City. Fort Worth also has a Republican mayor, but its elections are nonpartisan and I could not document a formal partisan council majority. County elected prosecutors and judges aren’t answering to just those who live in the cities, but except for 2024, these counties have voted overwhelmingly Democratic in recent presidential elections, and even the ones that Republicans won in 2024 were usually very narrow victories.
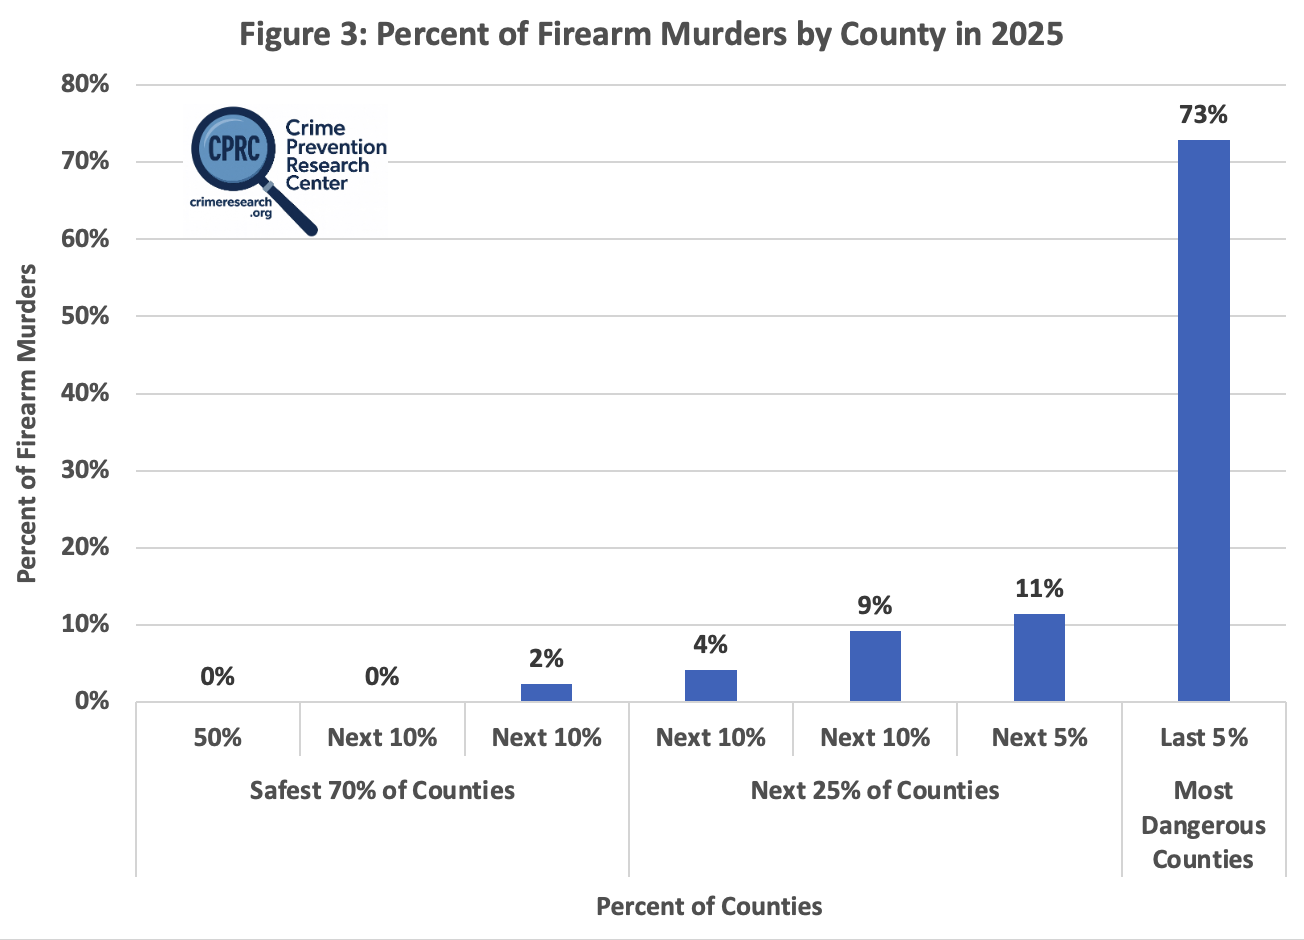
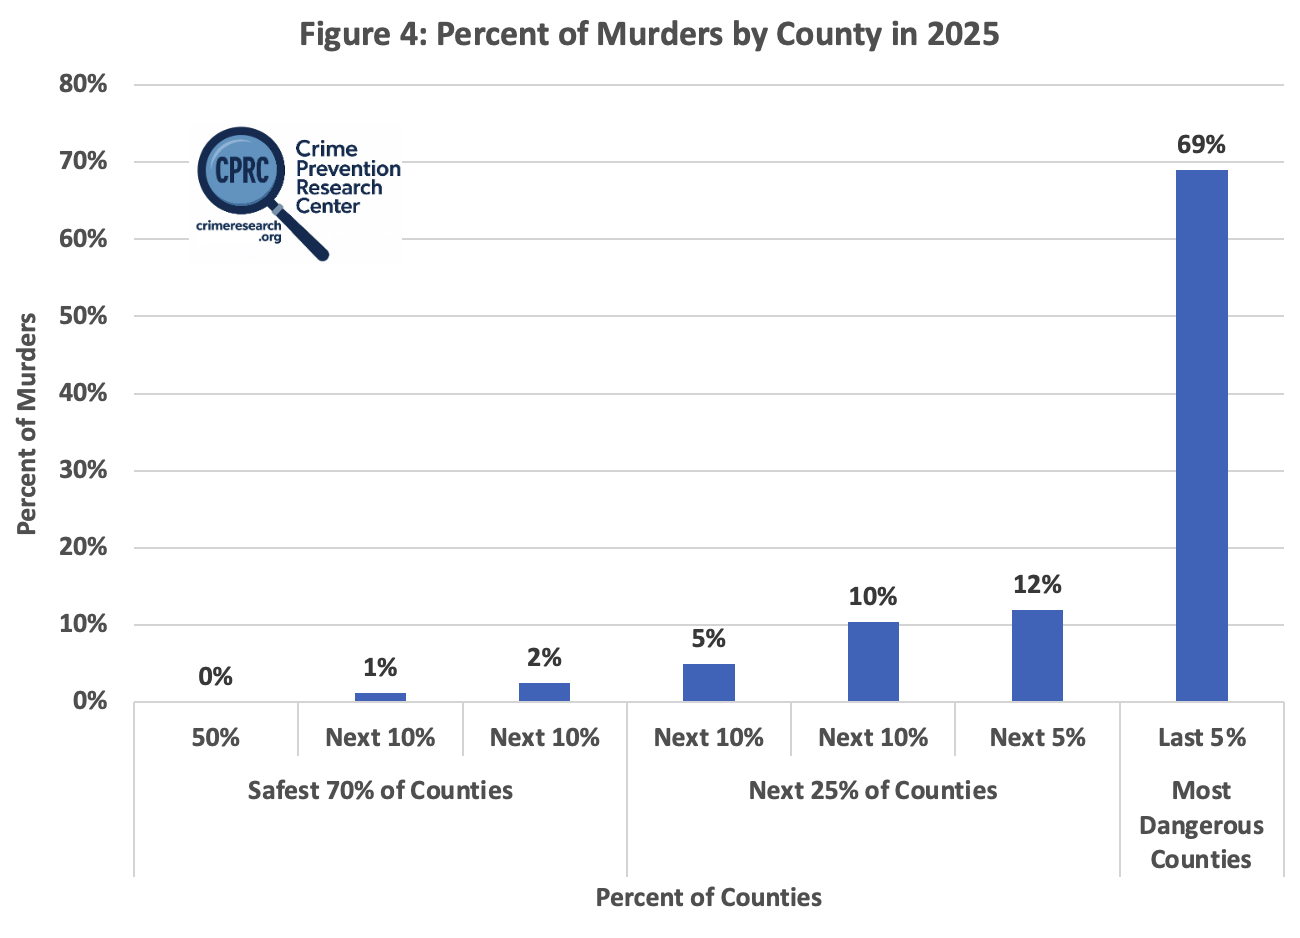
The next two figures show the cumulative percentages of murders for counties.
Finally, the last graphs track how the distribution of murders and population has changed since we began analyzing total murders in 2010. Murder concentration peaked in 2020, then gradually declined to roughly its 2016 level. The 1% and 2% of counties with the most murders have seen little change in their share of the U.S. population. Still, their slight population share decline may explain part of the drop in their share of murders between 2020 and 2024.
Using U.S.’s Metropolitan Statistical Areas (MSA)
Since we are also going to compare the U.S. data to Canada’s, we also break it down the U.S.’s Metropolitan Statistical Areas (MSA). Canadian Census Metropolitan Areas (CMAs) and U.S.’s Metropolitan Statistical Areas (MSA) offer broadly comparable metropolitan concepts, not U.S. counties. Both identify metropolitan areas around an urban core of at least 50,000 people and incorporate surrounding areas based partly on commuting integration. Canadian CMAs, however, must also have at least 100,000 residents overall and are built from municipalities, while U.S. MSAs are built from counties. The MSA data is available at the Federal Bureau of Investigation, Crime in the United States, 2025, Table 6, “Crime in the United States by Metropolitan Statistical Area, 2025.” And at the bottom of this post, the data for all 349 MSAs and the additional non-MSA is provided (Table 6).
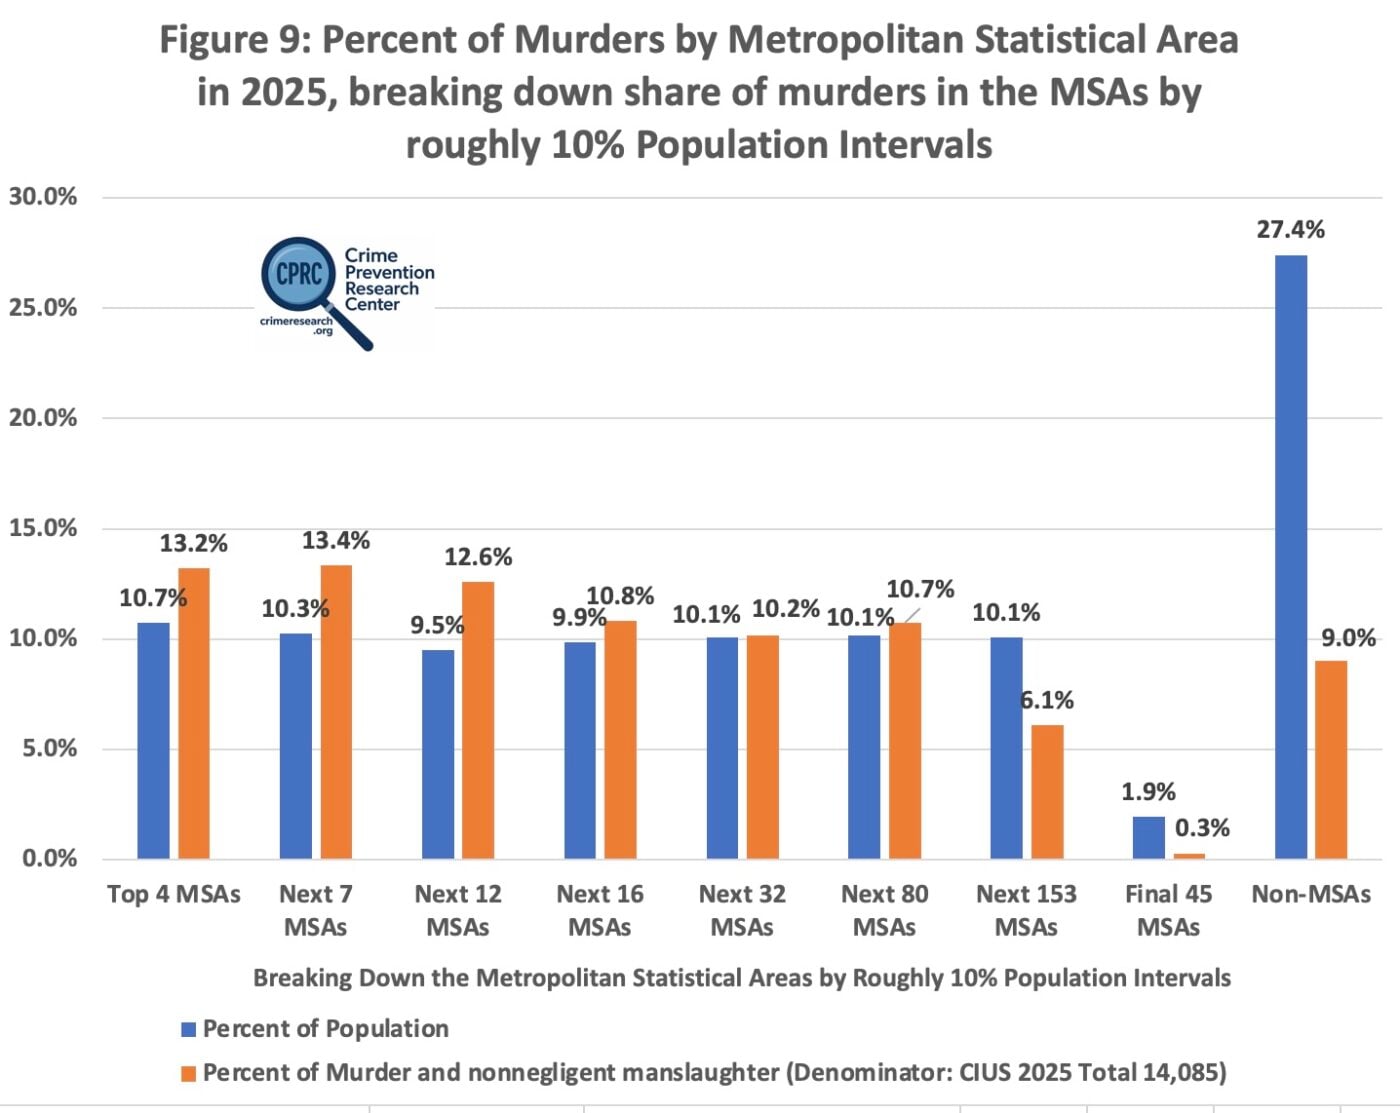
Figure 9 shows a less dramatic concentration of murders. When we rank MSAs by total murders, those containing the first 30% of the MSA population account for a share of murders 28.4 percentage points higher than their population share. For MSAs containing the next 30% of the population, the murder share exceeds the population share by only 5.4 percentage points. For the remaining 198 MSAs, which only represents about 12% of the U.S. population, their share of the population is almost twice their share of murders. The areas outside the MSAs include areas centered on urban populations of fewer than 50,000 residents, including small cities, towns, and rural areas, though some of these non-MSA areas don’t contain urban areas. This group is the most dramatic yet, with their share of the population more than three times their share of murders.
The pattern shows that for the MSAs with the most murders the share of murders greatly exceeds their share of the population, then in the middle area the share of murders roughly equals the share of the population, and then counties with few murders and in the areas outside the MSAs the share of murders is much lower than their share of the population. In switching from an area where the share of murders exceeds their share of the population to the reverse, there is an area in between where there isn’t much of a difference.
The discrepancy between the 12,768 total in the county-level analysis and the 14,085 total in the Metropolitan Statistical Area (MSA) analysis stems from differences in reporting parameters and the FBI’s estimation methodologies for missing data. Because participation in the Uniform Crime Reporting (UCR) program is voluntary, the FBI estimates missing data. For agencies in counties reporting three to 11 months of offense data, the FBI estimates the missing months using the data that the agency provided. For agencies reporting fewer than three months, the FBI estimates missing data using crime figures from similar areas within the state, taking into account population, type of jurisdiction, and geographic location. For the MSA data, the FBI includes an MSA in Table 6 only if its principal city or cities provide 12 complete months of data and at least 75% of the agencies within the MSA report data. Yet, the pattern that murders in the US are highly concentrated holds with both the county and MSA data.
Canada’s Data
Comparing the U.S.’s MSAs to Canada’s CMAs shows the U.S. homicides are clearly much more concentrated than those in Canada. While the MSAs with the most homicides consistently have a greater share of homicides than their share of the population, the opposite pattern is clearly true for Canada. For the three CMAs with the most homicides, they make up 35.4% of Canada’s population, but only 24.3% of its homicides, so overall their share of the homicides is only 69% of their share of the population (Table 1). The areas outside the CMAs provide a very sharp contrast to the areas outside the MSAs. It is in these areas outside the CMAs that you have 37.9% of the homicides but only 25.2% of the population, so their share of homicides is 51% more than their share of the population.
To phrase it differently, the report finds:
- All 41 CMAs: 74.8% of population, 62.1% of homicides
- Outside CMAs: 25.2% of population, 37.9% of homicides
That means the homicide share inside the CMAs is 17% less than its share of the population while the homicide share outside CMAs is indeed 51% greater than its population share. The difference in rates is striking: the homicide rate outside Canada’s CMAs is approximately 82% higher than inside CMAs.
The pattern is the reverse of what we see for U.S. MSAs. Among the Canadian CMAs with the most homicides, their share of homicides is substantially below their share of the population. Moving toward the middle, the two shares become more similar. Outside the CMAs, the relationship reverses: these areas contain only 25.1% of Canada’s population but account for 37.9% of its homicides. This is the exact opposite of the U.S. pattern, where the MSAs with the most murders account for disproportionately more murders, while areas outside MSAs account for disproportionately fewer.
| Table 1: Distribution of Homicides and Population by Canada’s Census Metropolitan Areas | |||
| CMA rank by homicide count | 2025 homicides | Share of Canada’s homicides | Share of Canada’s population |
| Top 3 (Toronto, Montréal, Vancouver) | 163 | 24.30% | 35.40% |
| Top 6 (Additional areas: Edmonton, Winnipeg, Ottawa–Gatineau) | 240 | 35.70% | 45.80% |
| Top 10 (Additional areas: Calgary, Halifax, Regina, Oshawa) | 285 | 42.40% | 53.50% |
| 11th–20th | 77 | 11.50% | 9.20% |
| 21st–30th | 40 | 6.00% | 8.30% |
| 31st–40th | 15 | 2.20% | 3.60% |
| 41st | 0 | 0.00% | 0.30% |
| All 41 CMAs | 417 | 62.10% | 74.8% |
| Outside CMAs | 255 | 37.90% | 25.2% |
| Canada total | 672 | 100% | 100% |
| Source: my calculations from Statistics Canada’s homicide table and published crime counts and rates used to reconstruct population denominators. https://www150.statcan.gc.ca/t1/tbl1/en/tv.action?pid=3510007101 | |||
| Table 2: Distribution of Homicides by Canada’s Six Worst Census Metropolitan Areas by Total Homicides | |||
| 2025 CMA | 2025 homicides | Share of Canada’s homicides | Share of Canada’s population |
| Toronto | 64 | 9.50% | 16.90% |
| Montréal | 52 | 7.70% | 11.20% |
| Vancouver | 47 | 7.00% | 7.40% |
| Edmonton | 32 | 4.80% | 4.10% |
| Winnipeg | 23 | 3.40% | 2.20% |
| Ottawa–Gatineau | 22 | 3.30% | 4.00% |
| 240 | 35.70% | 45.80% | |
| Source: my calculations from Statistics Canada’s homicide table and published crime counts and rates used to reconstruct population denominators. https://www150.statcan.gc.ca/t1/tbl1/en/tv.action?pid=3510007101 | |||
While it isn’t relevant for the issue of measuring how concentrated homicides are in Canada, there is one partial explanation for Canada’s opposite pattern compared to the U.S. Aboriginal people accounted for 203 of Canada’s 672 homicide victims, or 30.2%, even though Aboriginal people are only about 5% of Canada’s population. Statistics Canada puts the 2025 Aboriginal homicide rate at 9.59 per 100,000, roughly eight times the non-Indigenous rate of 1.13. This matters because Aboriginal Canadians are much less concentrated in large metropolitan areas than the Canadian population generally. For example, Statistics Canada reported that in 2020 59% of Aboriginal people lived outside CMAs, and correspondingly 59% of Aboriginal homicide victims were killed outside CMAs. By contrast, there were about 7.7 million American Indian or Alaska Native population alone or in combination with other race groups in 2024, about 2.26% of the 340.1 million Americans at that time. In 2023, American Indian or Alaska Native homicide victimizations numbered 250 (1.3% of the estimated 19,800 total), with a rate of 4.2 per 100,000. The rate for whites was 3.2 per 100,000.
By applying the 2020 geographic distribution of aboriginal homicide victims to the 203 aboriginal homicide victims in 2025 we can get a guess at how the homicide rates inside and outside of the CMAs would change if homicides against aboriginals was removed from the totals. In 2020, there were 201 aboriginal homicide victims, of whom: 118 (59%) occurred outside a CMA and 83 (41%) occurred in a CMA. Applying those 2020 percentages to the 203 aboriginal homicides victims in 2025 implies that there were 83 aboriginal homicides inside CMAs (203 x 41%) and 120 outside CMAs (203 x 59%).
This adjustment reduces the gap between the outside CMAs share of homicides from 37.9% to 28.8% and their share of population from 25.2% to 23.7% — so the gap declines from 12.7 percentage points to 5.1 percentage points (Table 3). Similarly, the gap between the 41 CMAs share of homicides increases from 62.1% to 71.22% while their share of the population increases from 74.8% to 76.33% — so that gap also gets smaller, but it still shows that the CMAs have a smaller share of homicides than their share of the population.
Nor does it appear the gap can be explained by aboriginals killing non-aboriginals. Statistics Canada’s linked homicide and court data show that homicide is heavily concentrated within aboriginal-status groups. Among aboriginal women and girls in the linked cases, 83% of accused persons were aboriginal, compared with only 5% of accused persons associated with non-aboriginal female homicide victims. Statistics Canada does not publish the equivalent aboriginal/non-aboriginal victim-by-accused breakdown for male victims in this table.
| Table 3: Showing How the Relative Shares of Homicides and Population Change When the Aboriginal Population is Removed from the Sample | ||||||
| Geography | All 2025 homicides | Using 2025 homicide data | Illustrative Indigenous victims removed using 2020 geographic distribution of aboriginal homicide victims | Remaining homicides after aboriginal homicide victims removed | Share of remaining homicides | Share of remaining population after aboriginal population removed |
| 41 CMAs | 417 | 62.05% | 83 | 334 | 71.22% | 76.33% |
| Outside CMAs | 255 | 37.95% | 120 | 135 | 28.78% | 23.67% |
While the MSAs and CMAs provide the most similar communities, we can also compare U.S. counties with CMAs, though this comparison is only suggestive. For example, the stark difference in concentration can be seen here: while 40% of U.S. murders occur where 20% of the people live in the 1% of the counties with the most murders, Toronto with the most homicides accounted for 16.9% of the population and 9.5% of the homicides. If you add Toronto and Montréal together, you get 17.3% of the murders with 28.1% of the population. The worst three CMAs have 35.4% of the population and 24.3% of Canada’s homicides. At the other end of the spectrum, while 3.9% of murders in the U.S. occurred in counties with zero or one murder were where 19.7% of the population lives, in Canada outside the CMAs 25.1% of the people live there but it has 37.9% of the homicides.
Australia’s Data
Australia has quite good data for making a comparison similar to the Canadian CMA analysis, and although the Australian geography is somewhat different, it still allows a comparison in steps from very urban to very remote areas. The Australian Institute of Criminology’s National Homicide Monitoring Program (NHMP) publishes homicide incidents by the Australian Bureau of Statistics’ Remoteness Areas—Major Cities, Inner Regional, Outer Regional, Remote, and Very Remote. The latest report, Homicide in Australia 2024–25, records 264 homicide incidents and 279 victims.
Australia shows a pattern strikingly similar to Canada’s. Major Cities contain a much larger share of Australia’s population than of its homicides, while the relationship progressively reverses as areas become more remote. The ratio of an area’s homicide share to its population share rises from 0.85 in Major Cities to 1.02 in Inner Regional areas, 1.36 in Outer Regional areas, 3.38 in Remote areas, and 4.12 in Very Remote areas (Table 4). Thus, as in Canada, homicides become increasingly disproportionate to population as we move away from the largest urban areas.
| Table 4: Distribution of Homicides and Population by Australia’s Remoteness Areas | |||||
| Australian Remoteness Area, 2024–25 | Homicide incidents | Share of homicide incidents | 2025 population estimates in millions | Share of population | Ratio of share of homicides and population |
| 163 Major Cities | 163 | 61.70% | 20.143067 | 72.9% | 0.846 |
| 47 Inner Regional | 47 | 17.80% | 4.802176 | 17.4% | 1.024 |
| 28 Outer Regional | 28 | 10.60% | 2.156945 | 7.8% | 1.357 |
| 10 Remote | 10 | 3.80% | 0.310127 | 1.1% | 3.384 |
| 8 Very Remote | 8 | 3.00% | 0.201339 | 0.7% | 4.115 |
| Not stated/unknown — Homicides could not be assigned to one of the five Remoteness Area categories | 8 | 3.00% | — | ||
| Total | 264 | 100% | 27.613654 | 100.0% | |
Again, while it isn’t central to the question of how concentrated homicides are in Australia, as was true for Canada, aboriginal and Torres Strait Islander people (hereafter, aboriginals) make up a disproportionate share of homicide offenders — about 3.8% of Australia’s population versus 24.7% of identified homicide offenders in 2024–25 (67 of 271). We have data on the share of each area’s population that are aboriginals (Table 5), but we are still looking for the share of homicide victims or murderers in the different areas who are aboriginals. The very limited historical evidence suggests that Indigenous homicide victimization is particularly important in Australia’s most remote areas. In 2005-2006 (p. 10), the AIC reported that 77% of homicide victims in Remote and Very Remote Australia were Indigenous (24 victims). However, the report did not provide comparable Indigenous percentages separately for Major Cities, Inner Regional, Outer Regional, Remote and Very Remote areas.
| Table 5: Aboriginal’s Share of the Population in Australia’s Remoteness Areas | |||
| Remoteness Area | 2025 population estimates in millions | Aboriginal & Torres Strait Islander population | Aboriginal share of area’s population |
| Major Cities | 20.143067 | 401,700 | 1.99% |
| Inner Regional | 4.802176 | 244,000 | 5.08% |
| Outer Regional | 2.156945 | 187,200 | 8.68% |
| Remote | 0.310127 | 58,700 | 18.93% |
| Very Remote | 0.201339 | 92,100 | 45.74% |
| Australia | 27.613654 | 983,709 | 3.56% |
Here is the data for all the U.S. MSAs and the non-MSA areas.
| Table 6: U.S. Metropolitan Statistical Areas: Murders, Percent of Murders, and Percent of Population | |||
| Metropolitan Statistical Area | Murder and nonnegligent manslaughter | Percent of Population | Percent of Murder and nonnegligent manslaughter (Denominator: CIUS 2025 Total 14,085) |
| Los Angeles-Long Beach-Anaheim, CA M. S. A. | 533 | 3.8% | 3.8% |
| Houston-Pasadena-The Woodlands, TX M. S. A. | 478 | 2.3% | 3.4% |
| Chicago-Naperville-Elgin, IL-IN M. S. A. | 470 | 2.8% | 3.3% |
| Atlanta-Sandy Springs-Roswell, GA M. S. A. | 378 | 1.9% | 2.7% |
| Dallas-Fort Worth-Arlington, TX M. S. A. | 374 | 2.5% | 2.7% |
| Philadelphia-Camden-Wilmington, PA-NJ-DE-MD M. S. A. | 319 | 1.9% | 2.3% |
| Detroit-Warren-Dearborn, MI M. S. A. | 258 | 1.3% | 1.8% |
| Washington-Arlington-Alexandria, DC-VA-MD-WV M. S. A. | 256 | 1.9% | 1.8% |
| St. Louis, MO-IL M. S. A. | 236 | 0.8% | 1.7% |
| Memphis, TN-MS-AR M. S. A. | 230 | 0.4% | 1.6% |
| Phoenix-Mesa-Chandler, AZ M. S. A. | 208 | 1.5% | 1.5% |
| Kansas City, MO-KS M. S. A. | 195 | 0.7% | 1.4% |
| Baltimore-Columbia-Towson, MD M. S. A. | 192 | 0.8% | 1.4% |
| Riverside-San Bernardino-Ontario, CA M. S. A. | 167 | 1.4% | 1.2% |
| Charlotte-Concord-Gastonia, NC-SC M. S. A. | 163 | 0.9% | 1.2% |
| Milwaukee-Waukesha, WI M. S. A. | 159 | 0.5% | 1.1% |
| Cleveland, OH M. S. A. | 141 | 0.6% | 1.0% |
| San Francisco-Oakland-Fremont, CA M. S. A. | 137 | 1.4% | 1.0% |
| San Antonio-New Braunfels, TX M. S. A. | 135 | 0.8% | 1.0% |
| Denver-Aurora-Centennial, CO M. S. A. | 125 | 0.9% | 0.9% |
| Virginia Beach-Chesapeake-Norfolk, VA-NC M. S. A. | 125 | 0.5% | 0.9% |
| Las Vegas-Henderson-North Las Vegas, NV M. S. A. | 120 | 0.7% | 0.9% |
| Birmingham, AL M. S. A. | 117 | 0.3% | 0.8% |
| Columbus, OH M. S. A. | 115 | 0.7% | 0.8% |
| Pittsburgh, PA M. S. A. | 115 | 0.7% | 0.8% |
| Indianapolis-Carmel-Greenwood, IN M. S. A. | 114 | 0.6% | 0.8% |
| Seattle-Tacoma-Bellevue, WA M. S. A. | 111 | 1.2% | 0.8% |
| Minneapolis-St. Paul-Bloomington, MN-WI M. S. A. | 107 | 1.1% | 0.8% |
| Richmond, VA M. S. A. | 99 | 0.4% | 0.7% |
| Cincinnati, OH-KY-IN M. S. A. | 96 | 0.7% | 0.7% |
| Austin-Round Rock-San Marcos, TX M. S. A. | 95 | 0.8% | 0.7% |
| Nashville-Davidson–Murfreesboro–Franklin, TN M. S. A. | 95 | 0.6% | 0.7% |
| Jacksonville, FL M. S. A.1 | 91 | 0.5% | 0.6% |
| Albuquerque, NM M. S. A. | 88 | 0.3% | 0.6% |
| Portland-Vancouver-Hillsboro, OR-WA M. S. A. | 88 | 0.7% | 0.6% |
| Oklahoma City, OK M. S. A. | 87 | 0.4% | 0.6% |
| Little Rock-North Little Rock-Conway, AR M. S. A. | 81 | 0.2% | 0.6% |
| Sacramento-Roseville-Folsom, CA M. S. A. | 74 | 0.7% | 0.5% |
| Montgomery, AL M. S. A. | 68 | 0.1% | 0.5% |
| Boston-Cambridge-Newton, MA-NH M. S. A. | 66 | 1.5% | 0.5% |
| Bakersfield-Delano, CA M. S. A. | 61 | 0.3% | 0.4% |
| Raleigh-Cary, NC M. S. A. | 58 | 0.5% | 0.4% |
| San Diego-Chula Vista-Carlsbad, CA M. S. A. | 56 | 1.0% | 0.4% |
| Columbia, SC M. S. A. | 55 | 0.3% | 0.4% |
| Jackson, MS M. S. A. | 54 | 0.2% | 0.4% |
| Augusta-Richmond County, GA-SC M. S. A. | 50 | 0.2% | 0.4% |
| Stockton-Lodi, CA M. S. A. | 50 | 0.2% | 0.4% |
| Winston-Salem, NC M. S. A. | 50 | 0.2% | 0.4% |
| Durham-Chapel Hill, NC M. S. A. | 49 | 0.2% | 0.3% |
| Fresno, CA M. S. A. | 49 | 0.3% | 0.3% |
| Mobile, AL M. S. A. | 49 | 0.1% | 0.3% |
| Tulsa, OK M. S. A. | 47 | 0.3% | 0.3% |
| Tucson, AZ M. S. A. | 46 | 0.3% | 0.3% |
| Charleston-North Charleston, SC M. S. A. | 43 | 0.3% | 0.3% |
| Fayetteville, NC M. S. A. | 43 | 0.1% | 0.3% |
| Wichita, KS M. S. A. | 43 | 0.2% | 0.3% |
| Greenville-Anderson-Greer, SC M. S. A. | 42 | 0.3% | 0.3% |
| Louisville/Jefferson County, KY-IN M. S. A. | 42 | 0.4% | 0.3% |
| Shreveport-Bossier City, LA M. S. A. | 42 | 0.1% | 0.3% |
| Florence, SC M. S. A. | 40 | 0.1% | 0.3% |
| Colorado Springs, CO M. S. A. | 38 | 0.2% | 0.3% |
| Buffalo-Cheektowaga, NY M. S. A. | 37 | 0.3% | 0.3% |
| Flint, MI M. S. A. | 37 | 0.1% | 0.3% |
| Akron, OH M. S. A. | 36 | 0.2% | 0.3% |
| El Paso, TX M. S. A. | 36 | 0.3% | 0.3% |
| Fort Wayne, IN M. S. A. | 36 | 0.1% | 0.3% |
| Rochester, NY M. S. A. | 36 | 0.3% | 0.3% |
| Salt Lake City-Murray, UT M. S. A. | 36 | 0.4% | 0.3% |
| San Jose-Sunnyvale-Santa Clara, CA M. S. A. | 36 | 0.6% | 0.3% |
| Omaha, NE-IA M. S. A. | 34 | 0.3% | 0.2% |
| Dayton-Kettering-Beavercreek, OH M. S. A. | 33 | 0.2% | 0.2% |
| Savannah, GA M. S. A. | 33 | 0.1% | 0.2% |
| Huntsville, AL M. S. A. | 31 | 0.2% | 0.2% |
| Knoxville, TN M. S. A. | 31 | 0.3% | 0.2% |
| Providence-Warwick, RI-MA M. S. A. | 29 | 0.5% | 0.2% |
| Gulfport-Biloxi, MS M. S. A. | 28 | 0.1% | 0.2% |
| Vallejo, CA M. S. A. | 28 | 0.1% | 0.2% |
| Harrisburg-Carlisle, PA M. S. A. | 27 | 0.2% | 0.2% |
| Albany, GA M. S. A. | 25 | 0.0% | 0.2% |
| Albany-Schenectady-Troy, NY M. S. A. | 25 | 0.3% | 0.2% |
| New Haven, CT M. S. A. | 25 | 0.2% | 0.2% |
| Tallahassee, FL M. S. A.1 | 25 | 0.1% | 0.2% |
| Anchorage, AK M. S. A. | 24 | 0.1% | 0.2% |
| Monroe, LA M. S. A. | 24 | 0.1% | 0.2% |
| Wilmington, NC M. S. A. | 24 | 0.1% | 0.2% |
| Beaumont-Port Arthur, TX M. S. A. | 23 | 0.1% | 0.2% |
| Lake Charles, LA M. S. A. | 23 | 0.1% | 0.2% |
| Reno, NV M. S. A. | 23 | 0.2% | 0.2% |
| Roanoke, VA M. S. A. | 23 | 0.1% | 0.2% |
| Saginaw, MI M. S. A. | 23 | 0.1% | 0.2% |
| Chattanooga, TN-GA M. S. A. | 22 | 0.2% | 0.2% |
| Corpus Christi, TX M. S. A. | 22 | 0.1% | 0.2% |
| Scranton–Wilkes-Barre, PA M. S. A. | 22 | 0.2% | 0.2% |
| Clarksville, TN-KY M. S. A. | 21 | 0.1% | 0.1% |
| Lafayette, LA M. S. A. | 21 | 0.1% | 0.1% |
| Tuscaloosa, AL M. S. A. | 21 | 0.1% | 0.1% |
| Auburn-Opelika, AL M. S. A. | 20 | 0.1% | 0.1% |
| Columbus, GA-AL M. S. A. | 20 | 0.1% | 0.1% |
| Hammond, LA M. S. A. | 20 | 0.0% | 0.1% |
| Kingsport-Bristol, TN-VA M. S. A. | 20 | 0.1% | 0.1% |
| McAllen-Edinburg-Mission, TX M. S. A. | 20 | 0.3% | 0.1% |
| Myrtle Beach-Conway-North Myrtle Beach, SC M. S. A. | 20 | 0.1% | 0.1% |
| Toledo, OH M. S. A. | 20 | 0.2% | 0.1% |
| Visalia, CA M. S. A. | 20 | 0.1% | 0.1% |
| Lakeland-Winter Haven, FL M. S. A.1 | 19 | 0.3% | 0.1% |
| Macon-Bibb County, GA M. S. A. | 19 | 0.1% | 0.1% |
| Rocky Mount, NC M. S. A. | 19 | 0.0% | 0.1% |
| Springfield, MA M. S. A. | 19 | 0.1% | 0.1% |
| Springfield, MO M. S. A. | 19 | 0.1% | 0.1% |
| Trenton-Princeton, NJ M. S. A. | 19 | 0.1% | 0.1% |
| Greenville, NC M. S. A. | 18 | 0.1% | 0.1% |
| Hilton Head Island-Bluffton-Port Royal, SC M. S. A. | 18 | 0.1% | 0.1% |
| Lexington-Fayette, KY M. S. A. | 18 | 0.2% | 0.1% |
| Reading, PA M. S. A. | 18 | 0.1% | 0.1% |
| York-Hanover, PA M. S. A. | 18 | 0.1% | 0.1% |
| Alexandria, LA M. S. A. | 17 | 0.0% | 0.1% |
| Hartford-West Hartford-East Hartford, CT M. S. A. | 17 | 0.3% | 0.1% |
| Muskegon-Norton Shores, MI M. S. A. | 17 | 0.1% | 0.1% |
| Santa Rosa-Petaluma, CA M. S. A. | 17 | 0.1% | 0.1% |
| Springfield, IL M. S. A. | 17 | 0.1% | 0.1% |
| Sumter, SC M. S. A. | 17 | 0.0% | 0.1% |
| Yuma, AZ M. S. A. | 17 | 0.1% | 0.1% |
| Canton-Massillon, OH M. S. A. | 16 | 0.1% | 0.1% |
| Jackson, TN M. S. A. | 16 | 0.1% | 0.1% |
| Las Cruces, NM M. S. A. | 16 | 0.1% | 0.1% |
| Modesto, CA M. S. A. | 16 | 0.2% | 0.1% |
| Salinas, CA M. S. A. | 16 | 0.1% | 0.1% |
| Champaign-Urbana, IL M. S. A. | 15 | 0.1% | 0.1% |
| Fayetteville-Springdale-Rogers, AR M. S. A. | 15 | 0.2% | 0.1% |
| Peoria, IL M. S. A. | 15 | 0.1% | 0.1% |
| Rockford, IL M. S. A. | 15 | 0.1% | 0.1% |
| Greeley, CO M. S. A. | 14 | 0.1% | 0.1% |
| Jackson, MI M. S. A. | 14 | 0.0% | 0.1% |
| Kalamazoo-Portage, MI M. S. A. | 14 | 0.1% | 0.1% |
| Madison, WI M. S. A. | 14 | 0.2% | 0.1% |
| Merced, CA M. S. A. | 14 | 0.1% | 0.1% |
| Ogden, UT M. S. A. | 14 | 0.2% | 0.1% |
| Oxnard-Thousand Oaks-Ventura, CA M. S. A. | 14 | 0.2% | 0.1% |
| Port St. Lucie, FL M. S. A.1 | 14 | 0.2% | 0.1% |
| Syracuse, NY M. S. A. | 14 | 0.2% | 0.1% |
| Yakima, WA M. S. A. | 14 | 0.1% | 0.1% |
| Asheville, NC M. S. A. | 13 | 0.1% | 0.1% |
| Daphne-Fairhope-Foley, AL M. S. A. | 13 | 0.1% | 0.1% |
| Davenport-Moline-Rock Island, IA-IL M. S. A. | 13 | 0.1% | 0.1% |
| Hanford-Corcoran, CA M. S. A. | 13 | 0.0% | 0.1% |
| Longview, TX M. S. A. | 13 | 0.1% | 0.1% |
| Lubbock, TX M. S. A. | 13 | 0.1% | 0.1% |
| Ocala, FL M. S. A.1 | 13 | 0.1% | 0.1% |
| Spokane-Spokane Valley, WA M. S. A. | 13 | 0.2% | 0.1% |
| Lake Havasu City-Kingman, AZ M. S. A. | 12 | 0.1% | 0.1% |
| Waterbury-Shelton, CT M. S. A. | 12 | 0.1% | 0.1% |
| Allentown-Bethlehem-Easton, PA-NJ M. S. A. | 11 | 0.3% | 0.1% |
| Bridgeport-Stamford-Danbury, CT M. S. A. | 11 | 0.281% | 0.1% |
| Decatur, IL M. S. A. | 11 | 0.029% | 0.1% |
| Goldsboro, NC M. S. A. | 11 | 0.035% | 0.1% |
| Napa, CA M. S. A. | 11 | 0.038% | 0.1% |
| Waco, TX M. S. A. | 11 | 0.090% | 0.1% |
| Charleston, WV M. S. A. | 10 | 0.059% | 0.1% |
| Chico, CA M. S. A. | 10 | 0.061% | 0.1% |
| Eugene-Springfield, OR M. S. A. | 10 | 0.112% | 0.1% |
| Jacksonville, NC M. S. A. | 10 | 0.063% | 0.1% |
| Sioux Falls, SD-MN M. S. A. | 10 | 0.092% | 0.1% |
| Ann Arbor, MI M. S. A. | 9 | 0.109% | 0.1% |
| Atlantic City-Hammonton, NJ M. S. A. | 9 | 0.109% | 0.1% |
| Kiryas Joel-Poughkeepsie-Newburgh, NY M. S. A. | 9 | 0.211% | 0.1% |
| Lansing-East Lansing, MI M. S. A. | 9 | 0.141% | 0.1% |
| Laredo, TX M. S. A. | 9 | 0.080% | 0.1% |
| Lynchburg, VA M. S. A. | 9 | 0.079% | 0.1% |
| Santa Maria-Santa Barbara, CA M. S. A. | 9 | 0.130% | 0.1% |
| Tyler, TX M. S. A. | 9 | 0.074% | 0.1% |
| Victoria, TX M. S. A. | 9 | 0.029% | 0.1% |
| Abilene, TX M. S. A. | 8 | 0.054% | 0.1% |
| Boise City, ID M. S. A. | 8 | 0.252% | 0.1% |
| Dothan, AL M. S. A. | 8 | 0.046% | 0.1% |
| Duluth, MN-WI M. S. A. | 8 | 0.083% | 0.1% |
| Evansville, IN M. S. A. | 8 | 0.080% | 0.1% |
| Farmington, NM M. S. A. | 8 | 0.035% | 0.1% |
| Fort Collins-Loveland, CO M. S. A. | 8 | 0.111% | 0.1% |
| Fort Smith, AR-OK M. S. A. | 8 | 0.069% | 0.1% |
| Houma-Bayou Cane-Thibodaux, LA M. S. A. | 8 | 0.058% | 0.1% |
| Janesville-Beloit, WI M. S. A. | 8 | 0.048% | 0.1% |
| Monroe, MI M. S. A. | 8 | 0.046% | 0.1% |
| Odessa, TX M. S. A. | 8 | 0.050% | 0.1% |
| Rapid City, SD M. S. A. | 8 | 0.046% | 0.1% |
| Salem, OR M. S. A. | 8 | 0.130% | 0.1% |
| Sierra Vista-Douglas, AZ M. S. A. | 8 | 0.037% | 0.1% |
| Slidell-Mandeville-Covington, LA M. S. A. | 8 | 0.083% | 0.1% |
| St. George, UT M. S. A. | 8 | 0.062% | 0.1% |
| Valdosta, GA M. S. A. | 8 | 0.045% | 0.1% |
| Altoona, PA M. S. A. | 7 | 0.035% | 0.0% |
| Binghamton, NY M. S. A. | 7 | 0.072% | 0.0% |
| Brownsville-Harlingen, TX M. S. A. | 7 | 0.127% | 0.0% |
| Charlottesville, VA M. S. A. | 7 | 0.067% | 0.0% |
| Cheyenne, WY M. S. A. | 7 | 0.030% | 0.0% |
| Coeur d’Alene, ID M. S. A. | 7 | 0.056% | 0.0% |
| Columbia, MO M. S. A. | 7 | 0.065% | 0.0% |
| Dalton, GA M. S. A. | 7 | 0.043% | 0.0% |
| Decatur, AL M. S. A. | 7 | 0.047% | 0.0% |
| Erie, PA M. S. A. | 7 | 0.078% | 0.0% |
| Fargo, ND-MN M. S. A.1 | 7 | 0.080% | 0.0% |
| Kennewick-Richland, WA M. S. A. | 7 | 0.094% | 0.0% |
| Lewiston, ID-WA M. S. A. | 7 | 0.019% | 0.0% |
| Provo-Orem-Lehi, UT M. S. A. | 7 | 0.228% | 0.0% |
| Redding, CA M. S. A. | 7 | 0.053% | 0.0% |
| Vineland, NJ M. S. A. | 7 | 0.046% | 0.0% |
| Waterloo-Cedar Falls, IA M. S. A. | 7 | 0.050% | 0.0% |
| Bend, OR M. S. A. | 6 | 0.078% | 0.0% |
| Burlington, NC M. S. A. | 6 | 0.054% | 0.0% |
| Chambersburg, PA M. S. A. | 6 | 0.047% | 0.0% |
| Dover, DE M. S. A. | 6 | 0.057% | 0.0% |
| Florence-Muscle Shoals, AL M. S. A. | 6 | 0.046% | 0.0% |
| Gadsden, AL M. S. A. | 6 | 0.030% | 0.0% |
| Gainesville, GA M. S. A. | 6 | 0.066% | 0.0% |
| Hattiesburg, MS M. S. A. | 6 | 0.046% | 0.0% |
| Hot Springs, AR M. S. A. | 6 | 0.029% | 0.0% |
| Huntington-Ashland, WV-KY-OH M. S. A. | 6 | 0.107% | 0.0% |
| Jonesboro, AR M. S. A. | 6 | 0.041% | 0.0% |
| Lawrence, KS M. S. A. | 6 | 0.036% | 0.0% |
| Lincoln, NE M. S. A. | 6 | 0.103% | 0.0% |
| Medford, OR M. S. A. | 6 | 0.064% | 0.0% |
| Santa Fe, NM M. S. A. | 6 | 0.046% | 0.0% |
| Texarkana, TX-AR M. S. A. | 6 | 0.042% | 0.0% |
| Battle Creek, MI M. S. A. | 5 | 0.039% | 0.0% |
| Billings, MT M. S. A. | 5 | 0.057% | 0.0% |
| Burlington-South Burlington, VT M. S. A. | 5 | 0.067% | 0.0% |
| Cleveland, TN M. S. A. | 5 | 0.039% | 0.0% |
| College Station-Bryan, TX M. S. A. | 5 | 0.085% | 0.0% |
| Des Moines-West Des Moines, IA M. S. A. | 5 | 0.223% | 0.0% |
| Johnstown, PA M. S. A. | 5 | 0.038% | 0.0% |
| Lima, OH M. S. A. | 5 | 0.029% | 0.0% |
| Longview-Kelso, WA M. S. A. | 5 | 0.034% | 0.0% |
| Mansfield, OH M. S. A. | 5 | 0.037% | 0.0% |
| Midland, TX M. S. A. | 5 | 0.056% | 0.0% |
| Morgantown, WV M. S. A. | 5 | 0.042% | 0.0% |
| Mount Vernon-Anacortes, WA M. S. A. | 5 | 0.039% | 0.0% |
| Olympia-Lacey-Tumwater, WA M. S. A. | 5 | 0.089% | 0.0% |
| St. Cloud, MN M. S. A. | 5 | 0.061% | 0.0% |
| Terre Haute, IN M. S. A. | 5 | 0.050% | 0.0% |
| Wenatchee-East Wenatchee, WA M. S. A. | 5 | 0.037% | 0.0% |
| Amarillo, TX M. S. A. | 5 | 0.080% | 0.0% |
| Anniston-Oxford, AL M. S. A. | 4 | 0.034% | 0.0% |
| Athens-Clarke County, GA M. S. A. | 4 | 0.066% | 0.0% |
| Beckley, WV M. S. A. | 4 | 0.032% | 0.0% |
| Bellingham, WA M. S. A. | 4 | 0.069% | 0.0% |
| Bloomington, IL M. S. A. | 4 | 0.051% | 0.0% |
| Bremerton-Silverdale-Port Orchard, WA M. S. A. | 4 | 0.083% | 0.0% |
| Cedar Rapids, IA M. S. A. | 4 | 0.081% | 0.0% |
| Eau Claire, WI M. S. A. | 4 | 0.052% | 0.0% |
| Fairbanks-College, AK M. S. A. | 4 | 0.010% | 0.0% |
| Grand Junction, CO M. S. A. | 4 | 0.048% | 0.0% |
| Grants Pass, OR M. S. A. | 4 | 0.026% | 0.0% |
| Green Bay, WI M. S. A. | 4 | 0.098% | 0.0% |
| Lancaster, PA M. S. A. | 4 | 0.165% | 0.0% |
| Lawton, OK M. S. A. | 4 | 0.037% | 0.0% |
| Lexington Park, MD M. S. A. | 4 | 0.062% | 0.0% |
| Muncie, IN M. S. A. | 4 | 0.033% | 0.0% |
| Parkersburg-Vienna, WV M. S. A. | 4 | 0.026% | 0.0% |
| Pueblo, CO M. S. A. | 4 | 0.050% | 0.0% |
| Racine-Mount Pleasant, WI M. S. A. | 4 | 0.058% | 0.0% |
| Rome, GA M. S. A. | 4 | 0.030% | 0.0% |
| Sandusky, OH M. S. A. | 4 | 0.033% | 0.0% |
| San Luis Obispo-Paso Robles, CA M. S. A. | 4 | 0.082% | 0.0% |
| Sherman-Denison, TX M. S. A. | 4 | 0.045% | 0.0% |
| South Bend-Mishawaka, IN-MI M. S. A. | 4 | 0.095% | 0.0% |
| Staunton-Stuarts Draft, VA M. S. A. | 4 | 0.038% | 0.0% |
| Urban Honolulu, HI M. S. A. | 4 | 0.289% | 0.0% |
| Wausau, WI M. S. A. | 4 | 0.041% | 0.0% |
| Wichita Falls, TX M. S. A. | 4 | 0.044% | 0.0% |
| Yuba City, CA M. S. A. | 4 | 0.055% | 0.0% |
| Appleton, WI M. S. A. | 3 | 0.074% | 0.0% |
| Blacksburg-Christiansburg-Radford, VA M. S. A. | 3 | 0.053% | 0.0% |
| Boulder, CO M. S. A. | 3 | 0.097% | 0.0% |
| El Centro, CA M. S. A. | 3 | 0.053% | 0.0% |
| Elizabethtown, KY M. S. A. | 3 | 0.038% | 0.0% |
| Iowa City, IA M. S. A. | 3 | 0.054% | 0.0% |
| Kahului-Wailuku, HI M. S. A. | 3 | 0.047% | 0.0% |
| Kokomo, IN M. S. A. | 3 | 0.025% | 0.0% |
| La Crosse-Onalaska, WI-MN M. S. A. | 3 | 0.050% | 0.0% |
| Lafayette-West Lafayette, IN M. S. A. | 3 | 0.068% | 0.0% |
| Lebanon, PA M. S. A. | 3 | 0.043% | 0.0% |
| Lewiston-Auburn, ME M. S. A. | 3 | 0.034% | 0.0% |
| Manchester-Nashua, NH M. S. A. | 3 | 0.126% | 0.0% |
| Minot, ND M. S. A.1 | 3 | 0.022% | 0.0% |
| Morristown, TN M. S. A. | 3 | 0.038% | 0.0% |
| Niles, MI M. S. A. | 3 | 0.044% | 0.0% |
| Norwich-New London-Willimantic, CT M. S. A. | 3 | 0.064% | 0.0% |
| Owensboro, KY M. S. A. | 3 | 0.033% | 0.0% |
| Pittsfield, MA M. S. A. | 3 | 0.037% | 0.0% |
| Punta Gorda, FL M. S. A.1 | 3 | 0.063% | 0.0% |
| Sioux City, IA-NE-SD M. S. A. | 3 | 0.043% | 0.0% |
| Twin Falls, ID M. S. A. | 3 | 0.036% | 0.0% |
| Utica-Rome, NY M. S. A. | 3 | 0.085% | 0.0% |
| Walla Walla, WA M. S. A. | 3 | 0.018% | 0.0% |
| Winchester, VA-WV M. S. A. | 3 | 0.044% | 0.0% |
| Albany, OR M. S. A. | 2 | 0.039% | 0.0% |
| Bloomington, IN M. S. A. | 2 | 0.048% | 0.0% |
| Bowling Green, KY M. S. A. | 2 | 0.058% | 0.0% |
| Bozeman, MT M. S. A. | 2 | 0.038% | 0.0% |
| Cape Girardeau, MO-IL M. S. A. | 2 | 0.029% | 0.0% |
| Elmira, NY M. S. A. | 2 | 0.024% | 0.0% |
| Enid, OK M. S. A. | 2 | 0.018% | 0.0% |
| Great Falls, MT M. S. A. | 2 | 0.025% | 0.0% |
| Harrisonburg, VA M. S. A. | 2 | 0.041% | 0.0% |
| Helena, MT M. S. A. | 2 | 0.029% | 0.0% |
| Idaho Falls, ID M. S. A. | 2 | 0.051% | 0.0% |
| Logan, UT-ID M. S. A. | 2 | 0.048% | 0.0% |
| Manhattan, KS M. S. A. | 2 | 0.040% | 0.0% |
| Mankato, MN M. S. A. | 2 | 0.031% | 0.0% |
| Portland-South Portland, ME M. S. A. | 2 | 0.169% | 0.0% |
| Prescott Valley-Prescott, AZ M. S. A. | 2 | 0.074% | 0.0% |
| San Angelo, TX M. S. A. | 2 | 0.035% | 0.0% |
| Santa Cruz-Watsonville, CA M. S. A. | 2 | 0.076% | 0.0% |
| Traverse City, MI M. S. A. | 2 | 0.046% | 0.0% |
| Wheeling, WV-OH M. S. A. | 2 | 0.039% | 0.0% |
| Ames, IA M. S. A. | 1 | 0.038% | 0.0% |
| Barnstable Town, MA M. S. A. | 1 | 0.068% | 0.0% |
| Bay City, MI M. S. A. | 1 | 0.030% | 0.0% |
| Carson City, NV M. S. A. | 1 | 0.017% | 0.0% |
| Casper, WY M. S. A. | 1 | 0.023% | 0.0% |
| Corvallis, OR M. S. A. | 1 | 0.029% | 0.0% |
| Eagle Pass, TX M. S. A. | 1 | 0.017% | 0.0% |
| Fond du Lac, WI M. S. A. | 1 | 0.030% | 0.0% |
| Grand Island, NE M. S. A. | 1 | 0.023% | 0.0% |
| Jefferson City, MO M. S. A. | 1 | 0.044% | 0.0% |
| Johnson City, TN M. S. A. | 1 | 0.064% | 0.0% |
| Kenosha, WI M. S. A. | 1 | 0.049% | 0.0% |
| Kingston, NY M. S. A. | 1 | 0.054% | 0.0% |
| Michigan City-La Porte, IN M. S. A. | 1 | 0.033% | 0.0% |
| Oshkosh-Neenah, WI M. S. A. | 1 | 0.051% | 0.0% |
| Paducah, KY-IL M. S. A. | 1 | 0.030% | 0.0% |
| Rochester, MN M. S. A. | 1 | 0.068% | 0.0% |
| Salisbury, MD M. S. A. | 1 | 0.039% | 0.0% |
| St. Joseph, MO-KS M. S. A. | 1 | 0.035% | 0.0% |
| Weirton-Steubenville, WV-OH M. S. A. | 1 | 0.033% | 0.0% |
| Amherst Town-Northampton, MA M. S. A. | 0 | 0.050% | 0.0% |
| Bangor, ME M. S. A. | 0 | 0.046% | 0.0% |
| Bismarck, ND M. S. A.1 | 0 | 0.041% | 0.0% |
| Columbus, IN M. S. A. | 0 | 0.025% | 0.0% |
| Dubuque, IA M. S. A. | 0 | 0.029% | 0.0% |
| Gettysburg, PA M. S. A. | 0 | 0.032% | 0.0% |
| Glens Falls, NY M. S. A. | 0 | 0.037% | 0.0% |
| Ithaca, NY M. S. A. | 0 | 0.032% | 0.0% |
| Joplin, MO-KS M. S. A. | 0 | 0.061% | 0.0% |
| Midland, MI M. S. A. | 0 | 0.025% | 0.0% |
| Missoula, MT M. S. A. | 0 | 0.038% | 0.0% |
| Pinehurst-Southern Pines, NC M. S. A. | 0 | 0.032% | 0.0% |
| Pocatello, ID M. S. A. | 0 | 0.027% | 0.0% |
| Sheboygan, WI M. S. A. | 0 | 0.035% | 0.0% |
| Watertown-Fort Drum, NY M. S. A. | 0 | 0.033% | 0.0% |
| Non-MSA | 1,268 | 27.4% | 9.0% |
The share of murders and population of the major city in counties that had the most murders. As discussed in detail earlier, the city and county data are calculated differently by the FBI and thus should be viewed as approximate measures of the geographic concentration of murders within counties.
| Table 7: The Major City Share of County Murders and Population in the 1% of Counties that had the Most Murders (Excluding Counties where City and County are the Same) | |||||
| City | 2025 City Murder and Nonnegligent Manslaughter (Source: FBI, Crime in the United States, 2025, Table 6, “Crime in the United States by Metropolitan Statistical Area.”) | County | 2025 County Murder and Nonnegligent Manslaughter (Source: FBI, Supplementary Homicide Report, 2025) | City Share of County Murders | City Share of County Population |
| Los Angeles, CA | 225 | Los Angeles | 475 | 47% | 40% |
| Chicago, IL | 346 | Cook | 368 | 94% | 52% |
| Dallas, TX | 139 | Dallas | 212 | 66% | 50% |
| Detroit, MI | 165 | Wayne | 193 | 85% | 36% |
| Atlanta, GA | 100 | Fulton | 151 | 66% | 48% |
| St. Louis, MO | 141 | City of St. Louis | 141 | 100% | 28% |
| Kansas City, MO | 135 | Jackson | 136 | 99% | 71% |
| Milwaukee, WI | 142 | Milwaukee | 157 | 90% | 61% |
| Cleveland, OH | 103 | Cuyahoga | 122 | 84% | 29% |
| Oakland, CA | 55 | Alameda | 81 | 68% | 27% |
| Charlotte-Mecklenburg, NC | 93 | Mecklenburg | 105 | 89% | 84% |
| Albuquerque, NM | 72 | Bernalillo | 81 | 89% | 84% |
| Indianapolis, IN | 104 | Marion | 110 | 95% | 91% |
| Columbus, OH | 84 | Franklin | 94 | 89% | 69% |
| Cincinnati, OH | 66 | Hamilton | 76 | 87% | 38% |
| Birmingham, AL | 83 | Jefferson | 102 | 81% | 29% |
| Pittsburgh, PA | 31 | Allegheny | 72 | 43% | 25% |
| Houston, TX | 272 | Harris | 407 | 67% | 48% |
| San Antonio, TX | 106 | Bexar | 133 | 80% | 72% |
| Las Vegas, NV | 91 | Clark | 134 | 68% | 71% |
| Phoenix, AZ | 127 | Maricopa | 230 | 55% | 36% |
| Jacksonville, FL | . | Duval | 89 | . | 96% |
| Miami, FL | 25 | Miami-Dade | 104 | 24% | 18% |
| Oklahoma City, OK | 68 | Oklahoma | 76 | 89% | 88% |
| San Bernardino, CA | 22 | San Bernardino | 96 | 23% | 10% |
| Fort Worth, TX | 78 | Tarrant | 106 | 74% | 46% |
| Average | 74% | 52% | |||
| The 2025 City Murder are from the FBI, Crime in the United States, 2025, Table 6, “Crime in the United States by Metropolitan Statistical Area,” while the 2025 County Murder figures are from the FBI’s Supplementary Homicide Report (SHR), 2025. Limited data for 2025 were available for Florida. Jacksonville, FL population data is missing from the FBI CIUS, so it was obtained from the U.S. Census Bureau. | |||||
Here are the political leanings for the worst 1% of the counties in terms of murders (31 counties)
Strong Democratic Strongholds (22 Counties / Cities)
These areas are the most reliable Democratic strongholds in the country. Consistently Democrat presidential candidates winning by at least ten percentage points.
- Los Angeles, CA (Biden beat Trump by 44.7 percentage points in 2020, Harris beat Trump by 32.91 percentage points in 2024)
- Cook, IL (Chicago) (Biden beat Trump by 50.2 percentage points in 2020, Harris beat Trump by 41.55 percentage points in 2024)
- New York City, NY (Biden beat Trump by 53.5 percentage points in 2020, All 5 boroughs combined) (Harris beat Trump by 38.2 percentage points in 2024)
- Philadelphia, PA (Biden beat Trump by 63.5 percentage points in 2020, Harris beat Trump by 58.74 percentage points in 2024)
- Dallas, TX (Dallas) (Biden beat Trump by 31.6 percentage points in 2020, Harris beat Trump by 22.2 percentage points in 2024)
- Wayne, MI (Detroit) (Biden beat Trump by 37.9 percentage points in 2020, Harris beat Trump by 28.97 percentage points in 2024)
- Baltimore City, MD (Biden beat Trump by 76.6 percentage points in 2020, Harris beat Trump by 59.4 percentage points in 2024)
- Washington, DC (Biden beat Trump by 86.8 percentage points in 2020, Harris beat Trump by 83.81 percentage points in 2024)
- Fulton, GA (Biden beat Trump by 46.4 percentage points in 2020, Atlanta) (Harris beat Trump by 38.9 percentage points in 2024)
- St. Louis, MO (Biden beat Trump by 24.0 percentage points in 2020, Harris beat Trump by 23.4 percentage points in 2024)
- Jackson, MO (Biden beat Trump by 22.2 percentage points in 2020, Kansas City) (Harris beat Trump by 18.2 percentage points in 2024)
- Milwaukee, WI (Biden beat Trump by 39.8 percentage points in 2020, Harris beat Trump by 38.41 percentage points in 2024)
- Cuyahoga, OH (Biden beat Trump by 34.0 percentage points in 2020, Cleveland) (Harris beat Trump by 34.2 percentage points in 2024)
- DeKalb, GA (Atlanta metro) (Biden beat Trump by 67.5 percentage points in 2020, Harris beat Trump by 62.5 percentage points in 2024)
- Alameda, CA (Biden beat Trump by 62.5 percentage points in 2020, Oakland/Berkeley) (Harris beat Trump by 53.6 percentage points in 2024)
- Mecklenburg, NC (Charlotte) (Biden beat Trump by 35.1 percentage points in 2020, Harris beat Trump by 32.68 percentage points in 2024)
- Bernalillo, NM (Biden beat Trump by 24.5 percentage points in 2020, Albuquerque) (Harris beat Trump by 21.03 percentage points in 2024)
- Marion, IN (Indianapolis) (Biden beat Trump by 29.1 percentage points in 2020, Harris beat Trump by 27.6 percentage points in 2024)
- Franklin, OH (Columbus) (Biden beat Trump by 31.3 percentage points in 2020, Harris beat Trump by 28.4 percentage points in 2024)
- Hamilton County, OH (Cincinnati) (Biden beat Trump by 15.8 percentage points in 2020, Harris beat Trump by 14.9 percentage points in 2024)
- Jefferson, AL (Birmingham) (Biden beat Trump by 13.2 percentage points in 2020, Harris beat Trump by 10.4 percentage points in 2024)
- Allegheny, PA (Pittsburgh) (Biden beat Trump by 20.4 percentage points in 2020, Harris beat Trump by 20.3 percentage points in 2024)
Democrat counties or Leaning Democratic (3 Counties). At least it is possible for Democrats to win by less than ten percentage points.
- Harris, TX (Houston) (Biden beat Trump by 13.5 percentage points in 2020, Harris beat Trump by 5.5 percentage points in 2024)
- Bexar, TX (San Antonio) (Biden beat Trump by 18.2 percentage points in 2020, Harris beat Trump by 9.7 percentage points in 2024)
- Clark, NV (Las Vegas) (Biden beat Trump by 9.2 percentage points in 2020, Harris beat Trump by 2.6 percentage points in 2024)
Swing / Republican-Leaning (6 Counties). At least, Trump showed it was possible to win these counties in 2024, though all but one of these counties were won by Democrats in 2020, and even in the one that Trump won in both 2020 and 2024 the wins were only by about one percentage point.
- Maricopa, AZ (Phoenix): (Biden beat Trump by 3.47 percentage points in 2020, Trump beat Harris by 3.5 percentage points in 2024)
- Duval, FL (Jacksonville): Swing county that has switched between Trump in 2016 and 2024 and Biden in 2020. (Biden beat Trump by 3.9 percentage points in 2020, Trump beat Harris by 1.5 percentage points in 2024)
- Miami-Dade, FL: Historically Democratic, but recently flipped heavily Republican due to shifting Hispanic voter trends. (Biden beat Trump by 7.3 percentage points in 2020, Trump beat Harris by 11.45 percentage points in 2024)
- Oklahoma, OK: (Trump beat Biden by 1.1 percentage points in 2020, Trump beat Harris by 1.7 percentage points in 2024).
- San Bernardino, CA (Biden beat Trump by 10.7 percentage points in 2020, Trump beat Harris by 2.14 percentage points in 2024)
- Tarrant, TX (Fort Worth): Traditionally one of the largest conservative urban counties in the country. (Biden beat Trump by 0.2 percentage points in 2020, Trump beat Harris by 5.19 percentage points in 2024)
| Table 8: In the counties where the major city doesn’t equal the entire county, how did those cities compare to the county vote in 2024? | |||
| City | City: Harris–Trump margin | County: Harris–Trump margin | City more Democratic by |
| Los Angeles, CA | Harris +45.1 | Harris +32.91 | 12.2 |
| Chicago, IL | Harris +59.4 | Harris +39.5 | 19.9 |
| Dallas, TX | Harris +30.4 | Harris +22.19 | 8.2 |
| Detroit, MI | Harris +~82 | Harris +28.88 | ~+53 |
| Atlanta, GA | Harris +~65 | Harris +38.9 | ~+26.1 |
| St. Louis, MO | Harris +~65.5 | Harris +23.40 | ~+42.1 |
| Kansas City, MO | Harris +~55.5 | Harris +18.2 | ~+37.3 |
| Milwaukee, WI | Harris +~57.5 | Harris +38.41 | ~+19.1 |
| Cleveland, OH | Harris +~63.5 | Harris +34.2 | ~+32.1 |
| Oakland, CA | Harris +76.21 | Harris +53.55 | 22.66 |
| Charlotte, NC | Harris +~39.5 | Harris +32.68 | ~+6.8 |
| Albuquerque, NM | Harris +~27.5 | Harris +21.03 | ~+6.5 |
| Indianapolis, IN | Harris +~29 | Harris +27.63 | ~+1.4 |
| Columbus, OH | Harris +39.0 | Harris +28.37 | 10.6 |
| Cincinnati, OH | Harris +~36.5 | Harris +14.87 | ~+21.6 |
| Birmingham, AL | Harris +~70 | Harris +10.37 | ~+59.6 |
| Pittsburgh, PA | Harris +~48.5 | Harris +20.31 | ~+28.2 |
| Houston, TX | Harris +~15 | Harris +5.53 | ~+9.5 |
| San Antonio, TX | Harris +~17 | Harris +9.74 | ~+7.3 |
| Las Vegas, NV | Harris +~8 | Harris +2.63 | ~+5.4 |
| Phoenix, AZ | Harris +~4 | Trump +3.47 | ~+7.5 |
| Jacksonville, FL | Harris +~1 | Trump +1.47 | ~+2.5 |
| Miami, FL | Harris +0.7 | Trump +11.45 | 12.2 |
| Oklahoma City, OK | Harris +~3 | Trump +1.68 | ~+4.7 |
| San Bernardino, CA | Harris +~19 | Trump +2.14 | ~+21.1 |
| Fort Worth, TX | Harris +~2 | Trump +5.19 | ~+7.2 |
| The ~ sign is used because some election offices don’t publish a presidential total for the city proper. Instead, the exact city result has to be constructed from precinct returns, and for some cities the precincts cross outside city boundaries, making the aggregation more complicated. | |||
| Table 9: Democrat Control of Mayoralties and City Councils | ||||
| Place | Mayor or executive | Ballot | Affiliation | Council or legislature |
| Los Angeles, CA (Harris +32) | Karen Bass | Nonpartisan | Democratic | Nonpartisan ballot; 14 Democrats, 1 independent |
| Chicago / Cook, IL (Harris +39.5) | Brandon Johnson | Partisan | Democratic | Democratic supermajority |
| New York City (Harris +38.2) | Zohran Mamdani | Partisan | Democratic | Democratic supermajority |
| Philadelphia, PA (Harris +58.6) | Cherelle Parker | Partisan | Democratic | Democratic, 14 of 17; 2 Working Families, 1 Republican |
| Dallas, TX (Harris +22.2) | Eric Johnson | Nonpartisan | Elected as a Democrat, but switched parties once in office. | Nonpartisan ballot; no formal caucus, Democratic-leaning control |
| Detroit / Wayne, MI (Harris +28.97) | Mary Sheffield | Nonpartisan | Democratic | Nonpartisan ballot; Democratic-affiliated |
| Baltimore City, MD (Harris +59.4) | Brandon Scott | Partisan | Democratic | Democratic majority |
| Washington, DC (Harris +83.8) | Muriel Bowser | Partisan | Democratic | Democratic majority. November 2026 election is open; Bowser is the incumbent until January 2027 |
| Atlanta / Fulton, GA (Harris +38.9) | Andre Dickens | Nonpartisan | Democratic | Nonpartisan ballot; Democratic-affiliated |
| St. Louis, MO (Harris +23.4) | Cara Spencer | Nonpartisan | Democratic | Nonpartisan ballot; Democratic-affiliated |
| Kansas City / Jackson, MO (Harris +18.2) | Quinton Lucas | Nonpartisan | Democratic | Nonpartisan ballot; Democratic-affiliated |
| Milwaukee, WI (Harris +38.4) | Cavalier Johnson | Nonpartisan | Democratic | Nonpartisan ballot; Democratic-affiliated |
| Cleveland / Cuyahoga, OH (Harris +34.2) | Justin Bibb | Nonpartisan | Democratic | Nonpartisan ballot; Democratic-affiliated |
| DeKalb, GA (Harris +62.5) | Lorraine Cochran-Johnson, county CEO; no single city mayor | Partisan | Democratic | Board of Commissioners, Democratic |
| Oakland / Alameda, CA (Harris +53.6) | Barbara Lee | Nonpartisan | Democratic | Nonpartisan ballot; Democratic-affiliated |
| Charlotte / Mecklenburg, NC (Harris +32.67) | Vi Lyles | Partisan | Democratic | Democratic majority |
| Albuquerque / Bernalillo, NM (Harris +21) | Tim Keller | Nonpartisan | Democratic | Nonpartisan ballot; Democratic-affiliated |
| Indianapolis / Marion, IN (Harris +27.5) | Joe Hogsett | Partisan | Democratic | Democratic majority |
| Columbus / Franklin, OH (Harris +28.37) | Andrew Ginther | Nonpartisan | Democratic | Nonpartisan ballot; Democratic-affiliated |
| Cincinnati / Hamilton, OH (Harris +14.9) | Aftab Pureval | Nonpartisan | Democratic | Nonpartisan ballot; Democratic-affiliated |
| Birmingham / Jefferson, AL (Harris +10.37) | Randall Woodfin | Partisan | Democratic | Democratic majority |
| Pittsburgh / Allegheny, PA (Harris +20.31) | Corey O’Connor | Partisan | Democratic | Democratic majority |
| Houston / Harris, TX (Harris +5.5) | John Whitmire | Nonpartisan | Democratic | Nonpartisan ballot; Democratic-leaning |
| San Antonio / Bexar, TX (Harris +9.7) | Gina Ortiz Jones | Nonpartisan | Democratic | Nonpartisan ballot; Democratic-leaning |
| Las Vegas / Clark, NV (Harris +2.63) | Shelley Berkley | Nonpartisan | Democratic | Nonpartisan ballot; Democratic-leaning |
| Phoenix / Maricopa, AZ (Trump +3.5) | Kate Gallego | Nonpartisan | Democratic | Nonpartisan ballot; Democratic-leaning |
| Jacksonville / Duval, FL (Trump +1.5) | Donna Deegan | Partisan | Democratic | Republican, 13–6 as of August 2026 |
| Miami / Miami-Dade, FL (Trump +11.4) | Eileen Higgins | Nonpartisan | Democratic | Nonpartisan ballot; no formal party majority |
| Oklahoma City / Oklahoma County (Trump +1.7) | David Holt | Nonpartisan | Republican | Nonpartisan ballot; Republican-associated majority, about 6–3 including the mayor |
| San Bernardino, CA (Trump +2.14) | Helen Tran | Nonpartisan | Democratic | Nonpartisan ballot; no formal party majority |
| Fort Worth / Tarrant, TX (Trump +5.1) | Mattie Parker | Nonpartisan | Republican | Nonpartisan ballot; no formal party majority |



0 Comments