
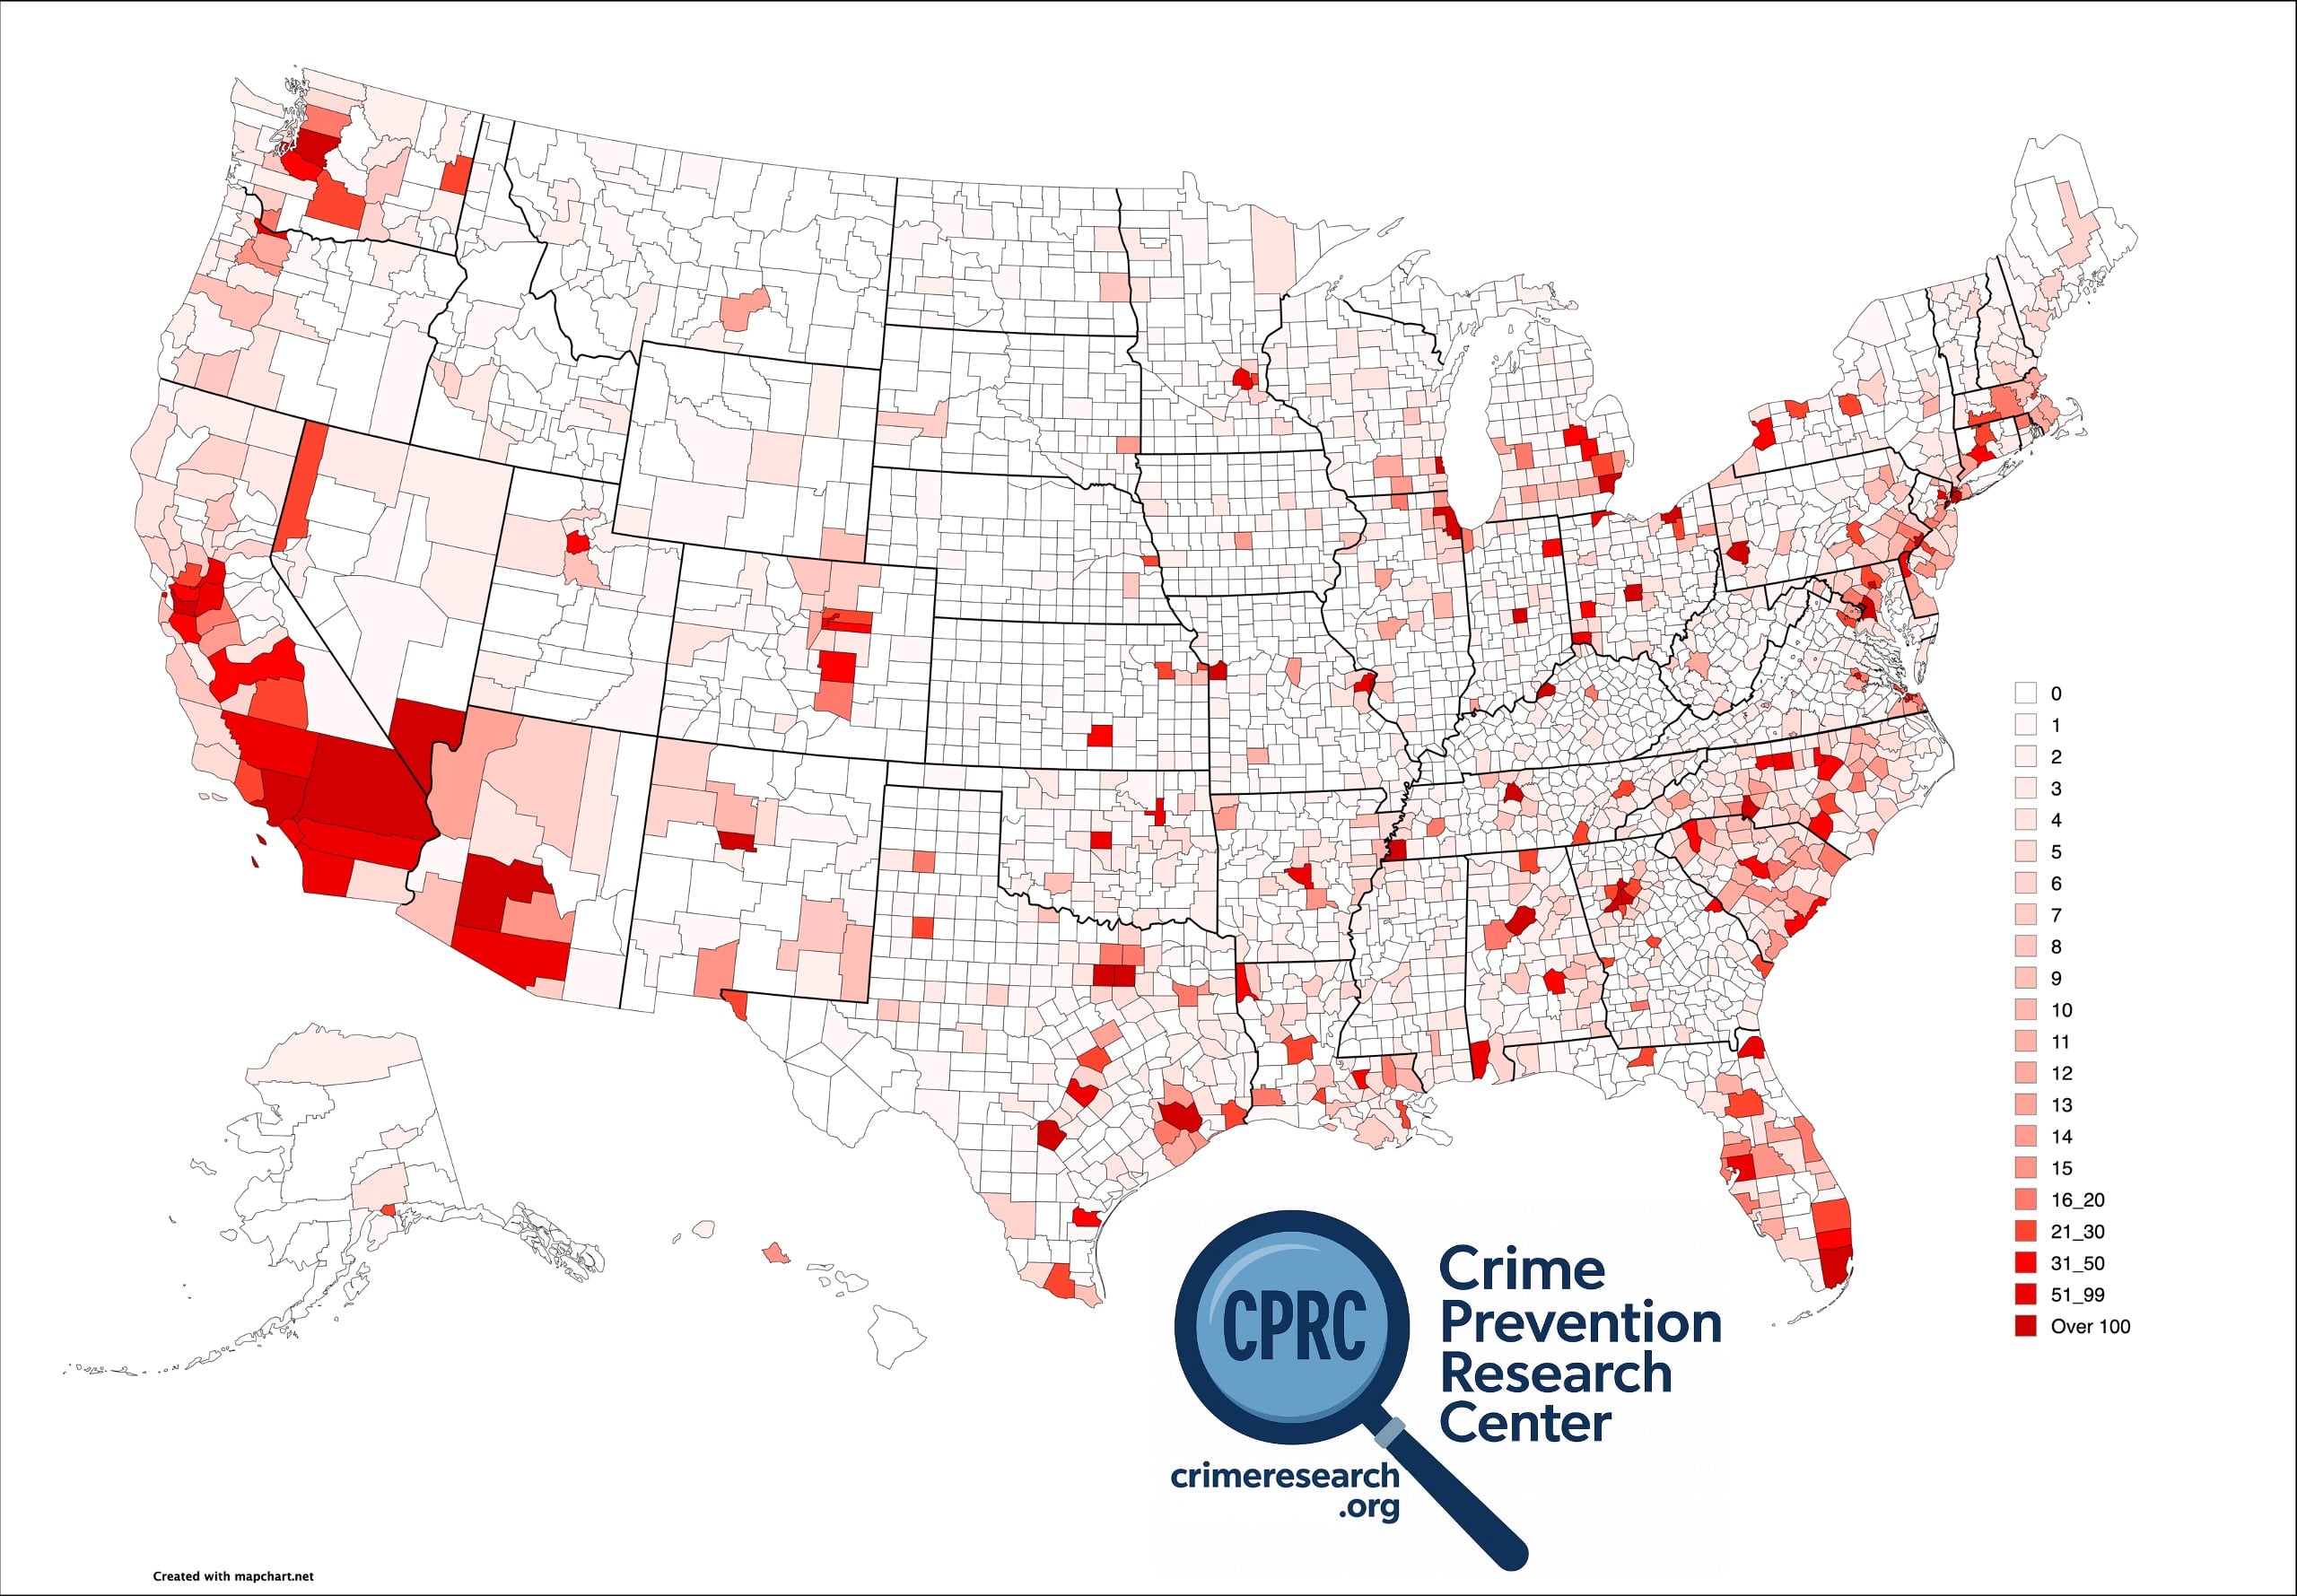
We have continued our reports on how very concentrated murders are in the United States. Our newest report is available here.
Abstract
The worst 1% of counties (the worst 31 counties) have 20% of the population and 41% of the murders. The worst 2% of counties (63 counties) contain 30% of the population and 54% of the murders. The worst 5% of counties contain 46% of the population and account for 71% of murders. But even within those counties, the murders are very heavily concentrated in small areas within those counties. By contrast, 53% of the counties have zero murders and another 16% have just one murder. These 69% of the counties account for only 3% of all murders in the country.
This concentration of murders remains near decade-long peak levels. Between 2010 and 2014, the share of murders occurring in the worst 5% of counties fell from 71% to 69%, but it then climbed to 73% in 2020 before easing back to 71% in 2024. Much of the increase was driven by the worst 1% and 2% of counties, whose shares of murders rose sharply between 2014 and 2020 and remained historically high in 2024, even though their shares of the U.S. population changed little over time.
Here are the political leanings for the worst 1% of the counties (31 counties)
Strong Democratic Strongholds (21 Counties / Cities)
These areas are the most reliable Democratic strongholds in the country.
- Los Angeles, CA
- Cook, IL (Chicago)
- New York City, NY (All 5 boroughs combined)
- Philadelphia, PA
- Wayne, MI (Detroit)
- Baltimore City, MD
- Washington, DC
- Fulton, GA (Atlanta)
- St. Louis, MO
- Jackson, MO (Kansas City)
- Milwaukee, WI
- Jefferson, KY (Louisville)
- Cuyahoga, OH (Cleveland)
- DeKalb, GA (Atlanta metro)
- Alameda, CA (Oakland/Berkeley)
- Mecklenburg, NC (Charlotte)
- Prince George’s, MD
- Bernalillo, NM (Albuquerque)
- Shelby, TN (Memphis)
- Marion, IN (Indianapolis)
- Franklin, OH (Columbus)
Leaning Democratic (6 Counties)
- Harris, TX (Houston)
- Dallas, TX
- Bexar, TX (San Antonio)
- Allegheny, PA (Pittsburgh)
- Clark, NV (Las Vegas)
- San Bernardino, CA
Swing / Republican-Leaning (4 Counties)
- Maricopa, AZ (Phoenix): The ultimate national swing county; razor-thin margins.
- Miami-Dade, FL: Historically Democratic, but recently flipped heavily Republican due to shifting Hispanic voter trends.
- Tarrant, TX (Fort Worth): Traditionally one of the largest conservative urban counties in the country.
- Jefferson, AL (Birmingham): Highly competitive swing area with split local control.



0 Comments