Updated: Comparing conviction rates between police and concealed carry permit holders

Feb 19, 2015 | Featured

A recent study provides numbers on police convictions over a three-year period from January 1, 2005 through December 31, 2007.  This data was put together by doing news searches on media sources throughout the US.  There are two reasons that their method makes police look relatively more law-abiding than they actually are.

— Not all cases where police officers have been convicted of crimes will obtain news coverage, and the authors of this study undoubtedly missed even some of the cases that were reported.    

The data on police counts the number of reported cases, not the number of officers involved in the crimes.  Some officers might also have multiple offenses in each case.  The first possibility means that the true crime rate for police is higher than we show below and thus means that there is a bigger gap between police and permit holders.  In any case, we will be comparing the number of police to the number of permit holders, not the number of crimes by police to the number of crimes by permit holders.  To put it simply, the possible cases where it “undercounts” crime aren’t relevant because we are counting the per person rate for both police and permit holders and thus the net effect of this is clearly to make police seem more law-abiding relative to permit holders and thus make the gap that we measure is smaller than the true gap.

While their numbers may somewhat underestimate the number of crimes for which police are convicted, their raw data serves as a useful starting point for analyzing the behavior of permit holders and for comparing police to citizens in general (surprisingly, this study in Police Quarterly just reports total crimes by police and makes no such comparisons).

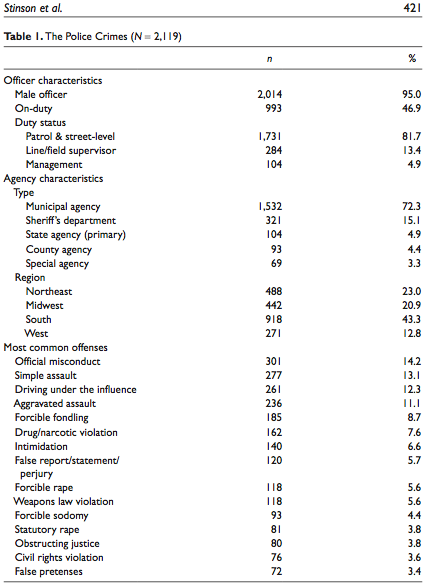
First, let’s convert their number into a crime rate by police.  Note that there were 683,396 full-time law enforcement employees in 2006.  With about 703 police crimes per year, there was a rate of 102 per hundred thousand full-time law enforcement employees (see page 421 in Exit Strategy: An Exploration of Late-Stage Police Crime” by Stinson, Liederbach, and Freiburger).  

For a comparison with concealed handgun permit holders, the rate of police facing weapons violations is of particular interest.  0.017% = 118/683,396

Compare that to firearms violations of concealed handgun permit holders in Florida.  Between October 1, 1987 and December 31, 2011, there were 168 revocations for firearms related violations in Florida (after January 2011, Florida stopped breaking out the firearms related violations by themselves).  Over that period permits were issued to over 2 million permit holders.  168/2 million = 0.008%.  For Texas for 2015, the rate was about 24/1 million = 0.0024%.  Michigan shows very similar rates of revocations of thousandths of a percentage point for firearms related violations.

But that isn’t a fair comparison for Florida permit holders because the violation rate for officers is an annual rate and the rate for permit holders is over the entire period.  In a 2011 Fox News piece, John Lott provided this calculation:

Over the last 36 months, only four permit holders have had their permit revoked for a firearms related violation — an annual revocation rate of 0.0003%. . . .

So putting the police numbers at an annual rate gives you a rate of 0.01%.  Both 0.01% or 0.0003% are both extremely low and the violations might not be comparable in that the private individuals might run into problems that a police officer (even one off duty might not run into), but the rate for police is still 23 times higher.

For all misdemeanors and felonies by police, the rate is 703 yearly average/683,396 full-time officers = 0.102%.  By contrast, for Texas in 2015, it was 108/1 million permit holders = 0.0102%.  For Florida, between October 1, 1987 and March 31, 2017,  10,868 concealed handgun permits were permanently revoked for misdemeanors, felonies, certain physical infirmities, incapacitation, or involuntarily committed for mental illness. This is an annual rate of 10.3 per 100,000 people who had a permit during that period – still a mere tenth of the rate at which officers commit misdemeanors and felonies.

Data for 22 other states is available in the third edition of “More Guns, Less Crime,” and it shows that the general revocation rates for permit holders are similar to the rate for Florida.

Other comparisons can also be made for police

The rate of forcible rape and sodomy for officers is 10.33 per 100,000 per year.  By contrast, the forcible rape rate for the general population was 30.9 in 2006.

The aggravated assault rate for officers was 11.49 per 100,000 per year.  By contrast, the rate for the general population was 287.5 in 2006.

Also of interest was this statement in the paper.

 The conviction rate among officers who were arrested with 18 or more years of service was 89.1%, whereas the conviction rate for officers who were arrested with 17 years or less of service was 77.5%.  . . .

As expected, the rate of crime for younger officers is a lot higher than for older ones.

The dissertation is available here.

Other data shows much higher rates of criminal violations by police.  The Honolulu Star-Advertiser claims that from 2010 to 2016 almost 16% of police officers have been arrested or prosecuted.

UPDATE: Another study funded by the National Institute of Justice has information on the number of officers arrested for crimes during the period from 2005 through 2011, though the numbers are very questionable and not of much use.  To look the data that overlaps part of the previous study shows 891 arrests in 2006 and 964 in 2007, an average of 927.5 per year.  At that rate, that implies about 75.8% of police who are arrested get convicted.  The true conviction rate is undoubtedly less than that as this study also relied on media reports and it seems that if the media tends to cover more serious cases, it might be less likely to cover an arrest of a police officer than a conviction.

As a warning, the previous paragraph should only be taken as suggestive.  The numbers between these two studies are somewhat hard to reconcile.  Take DUI offenses for police officers.  The NIJ study implies that about 14.3% of arrests involved DUIs.  Assuming that percentage held for the two years 2006 and 2007, that would imply 265 arrests for DUIs.  By contrast, the Police Quarterly study identified 261 convictions over the three years from 2005 to 2007.  Obviously, there can’t be more convictions than arrests, so there should be some caution here in comparing the results of these two studies.  Data for California for 2006 shows that for the general population about 90% of DUI arrests result in a conviction.

johnrlott

6 Comments

  1. Pat Friedrich

    The Department of Public Safety (DPS) tracks convictions in Texas. Based upon the latest data available, in 2012 Texas CHL holders were convicted of 120 offenses (https://www.txdps.state.tx.us/RSD/CHL/Reports/ConvictionRatesReport2012.pdf),
    As of January 1, 2012, there were 584,850 Texas CHL holders. That yields a conviction rate of 21 per 100,000 CHL holders. As of January 1, 2013, there 708,048 Texas CHL holders. That yield a conviction rate of 17 per 100,000 CHL holders. I suggest that the conviction rate for calendar year 2012 is somewhere in the middle. Law enforcement convictions are not tracked by TXDPS.

    • NotCop Block

      That’s CHL convictions for ALL offenses; the 10 and 11 per 100,000 rates for the police were solely for forcible rape/sodomy and aggravated assault INDIVIDUALLY.

      There may be some overlap but you can add them together with all of the other crimes of which the police may be convicted.

      Not to mention (but I will) the fact that it’s REALLY HARD to get a cop charged with anything that doesn’t make headlines, thin blue line and all.

      • Matt

        You use that term, thin blue line. I don’t that means what you think it means…

        • Matt

          don’t think*

      • Matt

        Oh and as to your argument, you’re arguing a point he didn’t make. “Law enforcement convictions are not tracked by TXDPS.” He merely made a statement about Texas concealed carriers. He made no comparison to law enforcement and admitted there were no directly comparable police numbers for Texas.

      • Matt

        It also just occurred to me, the point you tried to make about it being hard to get cops charged, really only supports the argument we’re making and that they make in this article. You imply that if it were easier, more cops would be charged with those crimes. So the cop number would go up and the concealed carrier number would stay the same and instead of being six times less likely than cops to be convicted of a firearm related crime, there would be even more of a disparity between the two rates.

Trackbacks/Pingbacks

  1. Episode 312 – Alexander Roubian, Richard Smith, Dean Weingarten, Sandra Muldoon and Shari Spivack | - […] the US for concealed carry holders, but the data we have for Florida says that the police were over…
  2. The New York Times Keeps Getting Its Gun Facts Shockingly Wrong | The Daily Caller - […] For example, while police are extremely law-abiding, being convicted of firearm violations at about 0.02 percent per year, the data…
  3. Yes, Virginia, There Is a Gun-Rights Movement. And It’s Winning. – Washington County PA Republican Party - […] lift the spirits of gun-control activists. Sure, the measures do little to combat crime, because concealed carriers commit crimes at…
  4. Concealed Carry Soars In Wisconsin; Murder Rate Drops | The Federalist Papers - […] put in perspective how law abiding concealed carry permit holders are, they misuse their privilege at a lower rate…
  5. A Look at the Facts on Gun-Free Zones – Jews Can Shoot - […] of the school rules, you have to realize how exceptionally law-abiding most permit holders are. Permit-holder firearms violations are…
  6. The Consequences of Militarized Police Forces - Investing Video & Audio Jay Taylor Media - […] Concealed Handgun License owners, who regularly carry their weapons, have a homicide rate that is just 1/12th of that…
  7. The Consequences of Militarized Police ForcesWestern Free Press | Western Free Press - […] Concealed Handgun License owners, who regularly carry their weapons, have a homicide rate that is just 1/12th of that…
  8. The Consequences of Militarized Police Forces – MediaLantang.Com - […] Concealed Handgun License owners, who regularly carry their weapons, have a homicide rate that is just 1/12th of that…
  9. The Consequences of Militarized Police Forces - Alternative Report - […] Concealed Handgun License owners, who regularly carry their weapons, have a homicide rate that is just 1/12th of that…
  10. The Consequences of Militarized Police Forces | Move Along People - […] Concealed Handgun License owners, who regularly carry their weapons, have a homicide rate that is just 1/12th of that…
  11. The Consequences of Militarized Police Forces | It's Not The Tea Party - […] Concealed Handgun License owners, who regularly carry their weapons, have a homicide rate that is just 1/12th of that…
  12. The Consequences of Militarized Police Forces - Austrian Economic Blogs - […] Concealed Handgun License owners, who regularly carry their weapons, have a homicide rate that is just 1/12th of that…
  13. "Cocks not Glocks", THOUSANDS of TX students 'carry' dildos to protest guns on campus - Page 13 - […] window._taboola = window._taboola || []; _taboola.push({article:'auto'}); !function (e, f, u) { e.async = 1; e.src = u; f.parentNode.insertBefore(e, f);…
  14. A Pro-gun Primer on Anti-gun Debate, Part 3 of 3 | - […] lead to an increase in crime. In fact, there’s evidence *suggesting* that concealed carriers are safer than police, and…
  15. Quora - Why are Americans so sure about the safety of having guns? You realize there are over 4million guns in the…
  16. My Homepage - ... [Trackback] [...] Read More: crimeresearch.org/2015/02/comparing-conviction-rates-between-police-and-concealed-carry-permit-holders/ [...]
  17. Lott: Police Commit More Gun Crimes Than Concealed Carry Permit Holders | ValuBit News - […] links to a CPRC study that shows that from January 1, 2005, through December 31, 2007, the yearly rate of…
  18. Lott: Police Commit More Gun Crimes Than Concealed Carry Permit Holders | GLA NEWS | Latest News - […] links to a CPRC study that shows that from January 1, 2005, through December 31, 2007, the yearly rate of…
  19. Police Commit More Gun Crimes Than Concealed Carry Permit Holders – Your Libertarian NewsCast - […] links to a CPRC study that shows that from January 1, 2005, through December 31, 2007, the yearly rate of…
  20. Lott: Police Commit More Gun Crimes Than Concealed Carry Permit Holders - Live President Donald Trump Popularity Polls - […] links to a CPRC study that shows that from January 1, 2005, through December 31, 2007, the yearly rate…
  21. Data Point - The Left is always yammering that only cops should have guns: they're trained! - GraniteGrok — GraniteGrok - […] is that even with all of the training that the Left keeps jamming down our throats, sometimes they aren’t…
  22. Police Commit More Gun Crimes Than Concealed Carry Permit Holders | Breaking News Wiki - […] links to a CPRC study that shows that from January 1, 2005, through December 31, 2007, the yearly rate of…
  23. Gun Control Groups Are Losing The Battle Against Suppressors - Free Market Shooter - […] even lower rate than police officers. According to a study in Police Quarterly, police committed an average of 703…
  24. Gun Control Groups Are Losing The Battle Against Suppressors – Earths Final Countdown - […] even lower rate than police officers. According to a study in Police Quarterly, police committed an average of 703…
  25. Gun Control Groups Are Losing The Battle Against SuppressorsSince 1998 Hitrust.net = Privacy and Protection | Since 1998 Hitrust.net = Privacy and Protection - […] even lower rate than police officers. According to a study in Police Quarterly, police committed an average of 703…
  26. Gun Control Groups Are Losing The Battle Against Suppressors | It's Not The Tea Party - […] even lower rate than police officers. According to a study in Police Quarterly, police committed an average of 703…
  27. Gun Control Groups Are Losing The Battle Against Suppressors | US-China News - […] even lower rate than police officers. According to a study in Police Quarterly, police committed an average of 703…
  28. Study: Concealed Permit Holders Among the Most Law-Abiding of Law-Abiding Citizens | ValuBit News - […] of misdemeanors and felonies committed by police officers. On May 27 Breitbart News reported a CPRC study which showed that from…
  29. Study: Concealed Permit Holders Among the Most Law-Abiding of Law-Abiding Citizens – New Right News - […] of misdemeanors and felonies committed by police officers. On May 27 Breitbart News reported a CPRC study which showed that from…
  30. Study: Concealed Permit Holders Among the Most Law-Abiding of Law-Abiding Citizens - Conservative News & Right Wing News | Gun Laws & Rights News Site : Conservative News & Right Wing News | Gun Laws & Rights News Site - […] of misdemeanors and felonies committed by police officers. On May 27 Breitbart News reported a CPRC study which showed that from…
  31. Cartoon County MN- The lunacy of it all. » Blog Archive » This should come as no surprise. CCW permit holders don’t want to commit crimes, they want to protect themselves and their families. One would think it would be painfully obvious. - […] of misdemeanors and felonies committed by police officers. On May 27 Breitbart News reported a CPRC study which showed that from…
  32. Concealed Permit Holders Among the Most Law-Abiding of Law-Abiding Citizens – Your Libertarian NewsCast - […] of misdemeanors and felonies committed by police officers. On May 27 Breitbart News reported a CPRC study which showed that from…
  33. It’s Not a War on Cops – A Soldier's Perspective - […] cops have no right to disarm them. If anyone should be afraid, it should be the people. The Crime…
  34. Nancy Pelosi: GOP Using National Reciprocity to Arm ‘Violent Criminals’ – Great Fast - […] carry permit holders in various states around the country. The report included a link to a previous CPRC study…
  35. Quote of the day—NRA | The View From North Central Idaho - […] NRADecember 6, 2017House approves concealed-carry reciprocity, gun bill faces challenge in Senate[The first sentence is factual and verifiable. See,…
  36. Daughter of Sandy Hook Elementary School Teacher: Campus Carry Creates a ‘Dangerous Environment’ - News Wire Now - […] Crime Prevent Research Center shows that from January 1, 2005, through December 31, 2007, the yearly rate of misdemeanors…
  37. Daughter of Sandy Hook Elementary School Teacher: Campus Carry Creates a 'Dangerous Environment' | Madrid Journals - […] Crime Prevent Research Center shows that from January 1, 2005, through December 31, 2007, the yearly rate of misdemeanors…
  38. Daughter of Sandy Hook Elementary School Teacher: Campus Carry Creates a 'Dangerous Environment' | usaat7 - […] Crime Prevent Research Center shows that from January 1, 2005, through December 31, 2007, the yearly rate of misdemeanors…
  39. Daughter of Sandy Hook Elementary School Teacher: Campus Carry Creates a 'Dangerous Environment' | The Business News Report - […] Crime Prevent Research Center shows that from January 1, 2005, through December 31, 2007, the yearly rate of misdemeanors…
  40. Daughter of Sandy Hook Elementary School Teacher: Campus Carry Creates a 'Dangerous Environment' | Evening Washington - […] Crime Prevent Research Center shows that from January 1, 2005, through December 31, 2007, the yearly rate of misdemeanors…
  41. Daughter of Sandy Hook Elementary School Teacher: Campus Carry Creates a 'Dangerous Environment' | japan daily sun - […] Crime Prevent Research Center shows that from January 1, 2005, through December 31, 2007, the yearly rate of misdemeanors…
  42. Daughter of Sandy Hook Elementary School Teacher: Campus Carry Creates a 'Dangerous Environment' | United Journalism News - […] Crime Prevent Research Center shows that from January 1, 2005, through December 31, 2007, the yearly rate of misdemeanors…
  43. Daughter of Sandy Hook Elementary School Teacher: Campus Carry Creates a ‘Dangerous Environment’ – Great Fast - […] Crime Prevent Research Center shows that from January 1, 2005, through December 31, 2007, the yearly rate of misdemeanors…
  44. Daughter of Sandy Hook Elementary School Teacher: Campus Carry Creates a 'Dangerous Environment' | malmoexpress - […] Crime Prevent Research Center shows that from January 1, 2005, through December 31, 2007, the yearly rate of misdemeanors…
  45. Daughter of Sandy Hook Elementary School Teacher: Campus Carry Creates a ‘Dangerous Environment’ – Britain Today News - […] Crime Prevent Research Center shows that from January 1, 2005, through December 31, 2007, the yearly rate of misdemeanors…
  46. Daughter of Sandy Hook Elementary School Teacher: Campus Carry Creates a 'Dangerous Environment' | Current Affairs Online - […] Crime Prevent Research Center shows that from January 1, 2005, through December 31, 2007, the yearly rate of misdemeanors…
  47. Daughter of Sandy Hook Elementary School Teacher: Campus Carry Creates a 'Dangerous Environment' | The Knightsbridge Times - […] Crime Prevent Research Center shows that from January 1, 2005, through December 31, 2007, the yearly rate of misdemeanors…
  48. Refuting ‘Gun Control’ Misconceptions And Showing Why It Doesn’t Work | Nova Dextra - […] study by the Crime Prevention Research Center found that individuals who have a concealed carry license are more law-abiding than…

Archives