
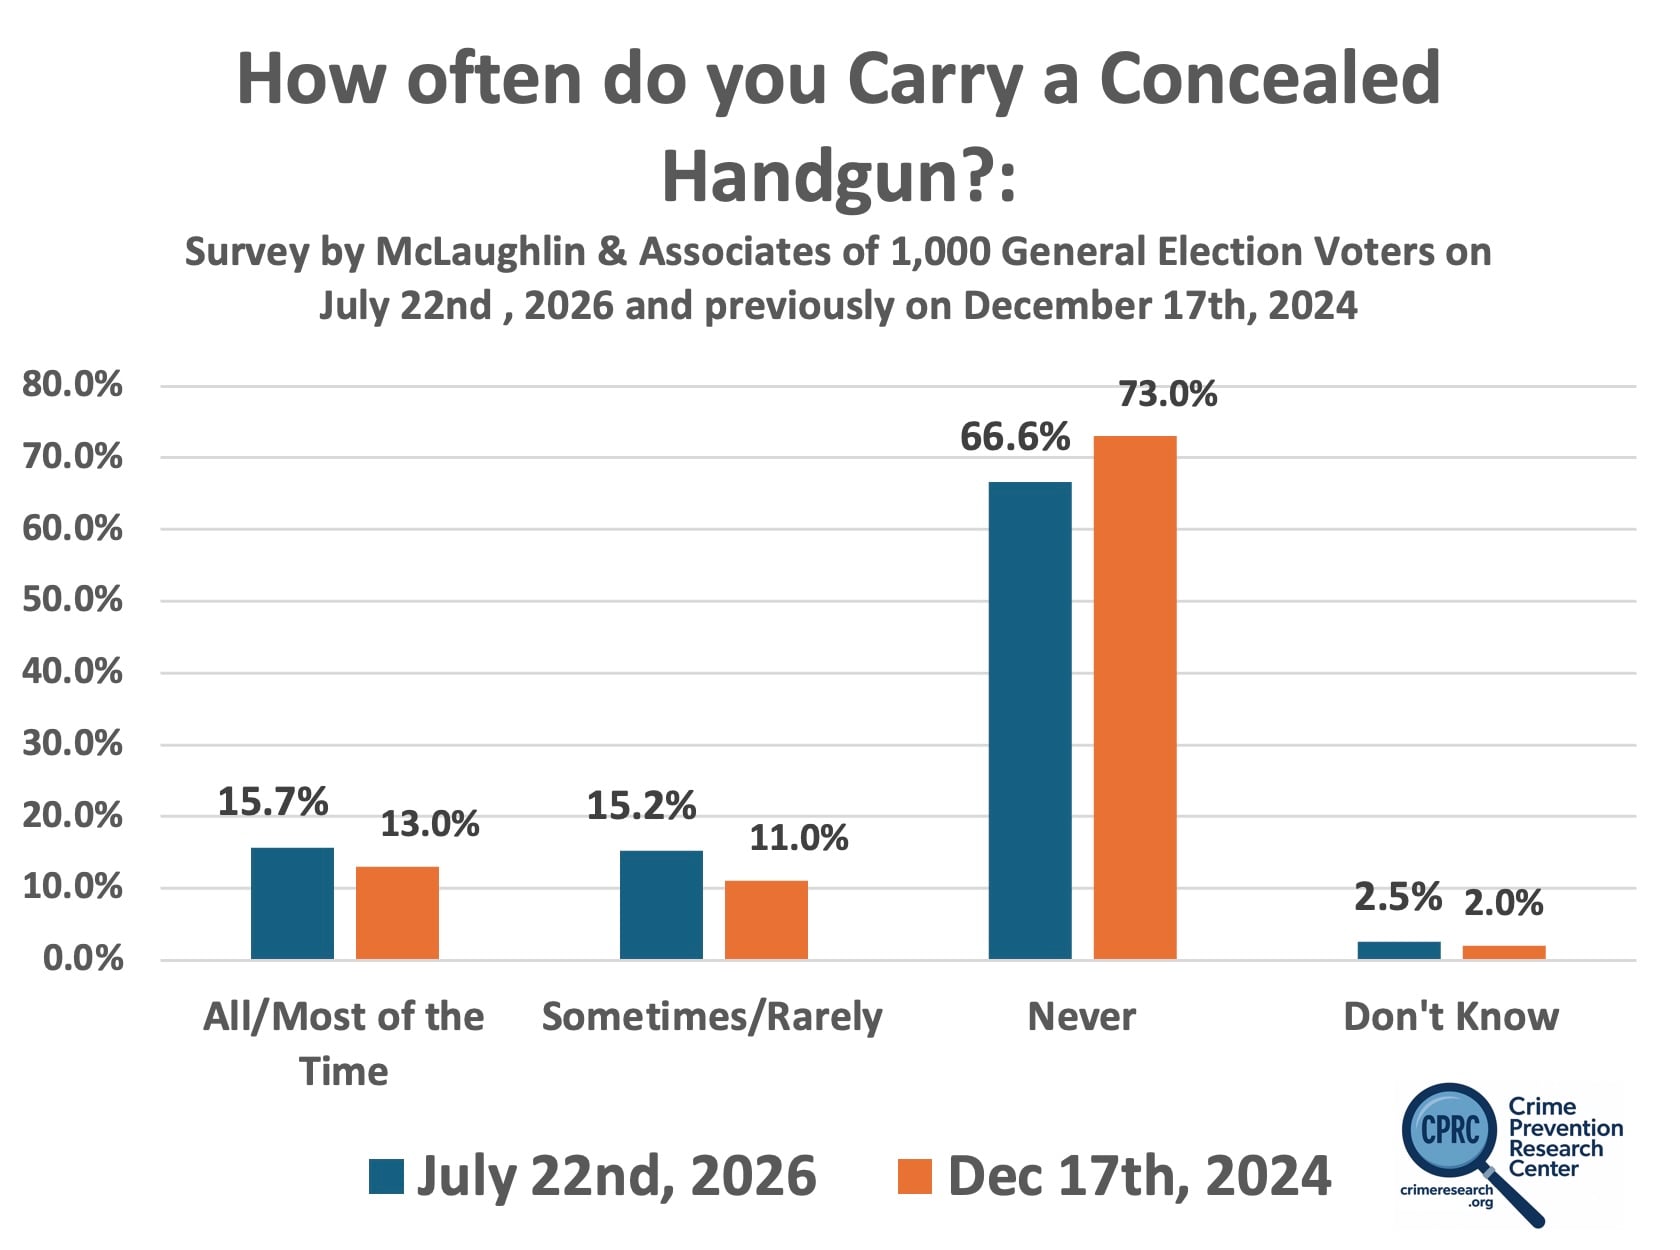
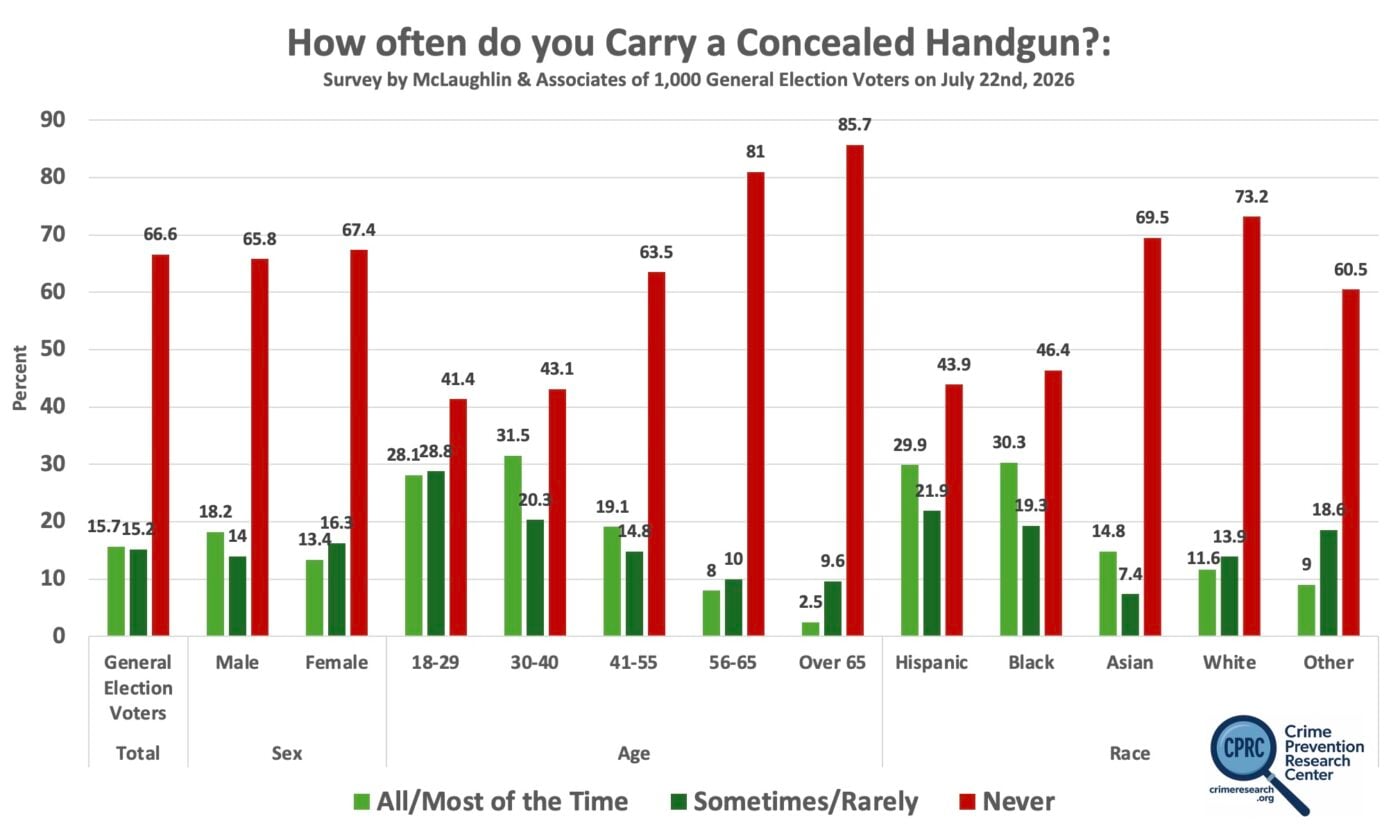
The CPRC hired McLaughlin & Associates to survey 1,000 general election voters on July 22nd, 2026 (cross tabs available here), regarding whether likely voters carry concealed handguns. In the survey, 15.7% carry all/most of the time, with another 15.2% carrying sometimes/rarely. The percent who carry all or most the time increased from 13.0% in December 2024 to 13.2% in May 2026 to 15.7% in July 2026. But total percent who care increased from 24.3% in December 2024 to 29.8% in May 2026 to 30.9% in July 2026. So the total who are carrying increased by 5.5 percentage points (from 24.3% to 29.8%).
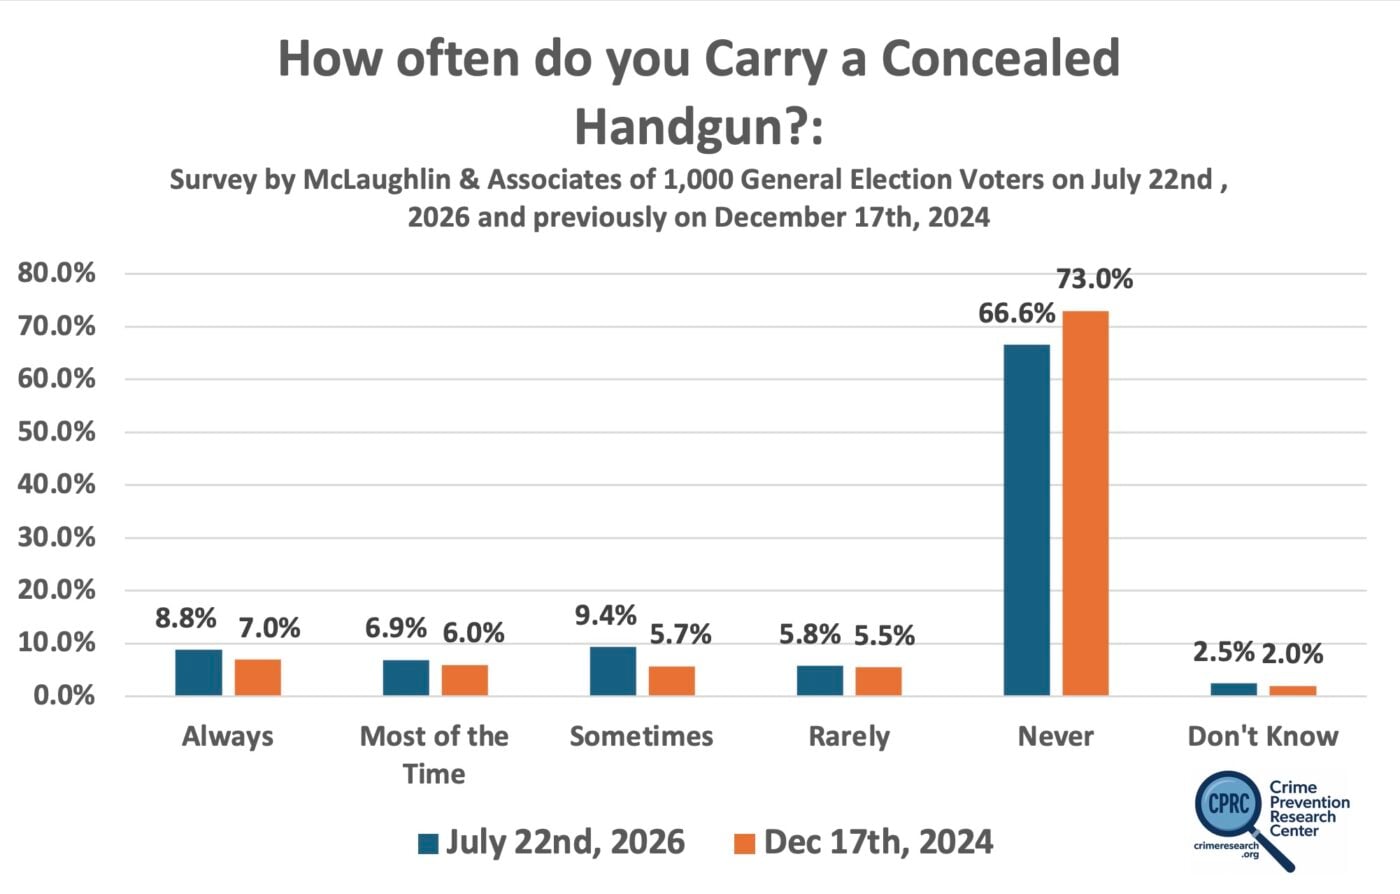
A further breakdown of the rate that people carry is shown here, with 8.8% carrying all the time and 6.9% most of the time. All the categories of carrying from always to rarely show increases over the last year and a half, with the larges changes being those who sometimes carry increasing by 3.7 percentage points and those who carry always increasing by 1.8 percentage points.
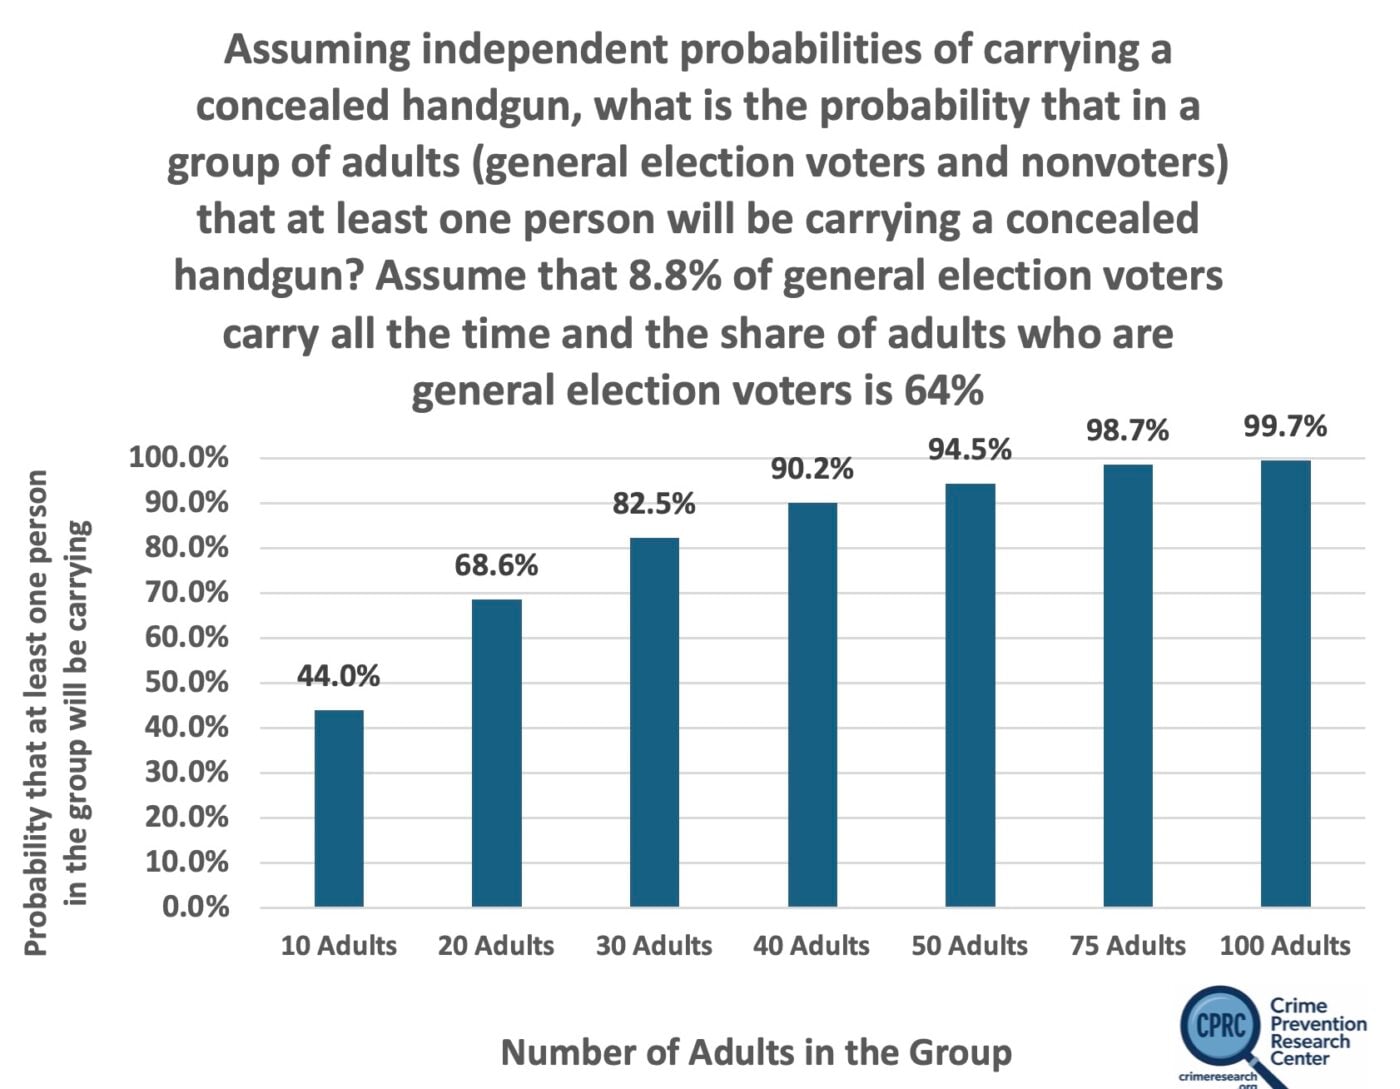
So what are the odds that if someone attacks a group of adults in public that at least one of the adults will have a concealed handgun in a venue that is not a gun-free zone. Assume that 6.3% of general election voters carry all the time and 64% of adults are general election voters, what is the probability that at least some in a group of adults will be carrying a concealed handgun. The formula is: P(at least one) = 1 – (1 – (0.64 * 0.088))n, where n is the number of adults in the area. If you assume that 8.8% carry all the time and 6.9% carry 80% of the time, the formula is: P(at least one) = 1 – (1 – ((0.088+(0.069×0.80))*0.64))n. These formulas assume that the probability that any one adult is carrying is independent of whether others are carrying. Obviously, if you are at an NRA convention that won’t be the case or if you are at a gun control convention, though as we will see later there are some surprising groups that tend to carry at relatively high rates.
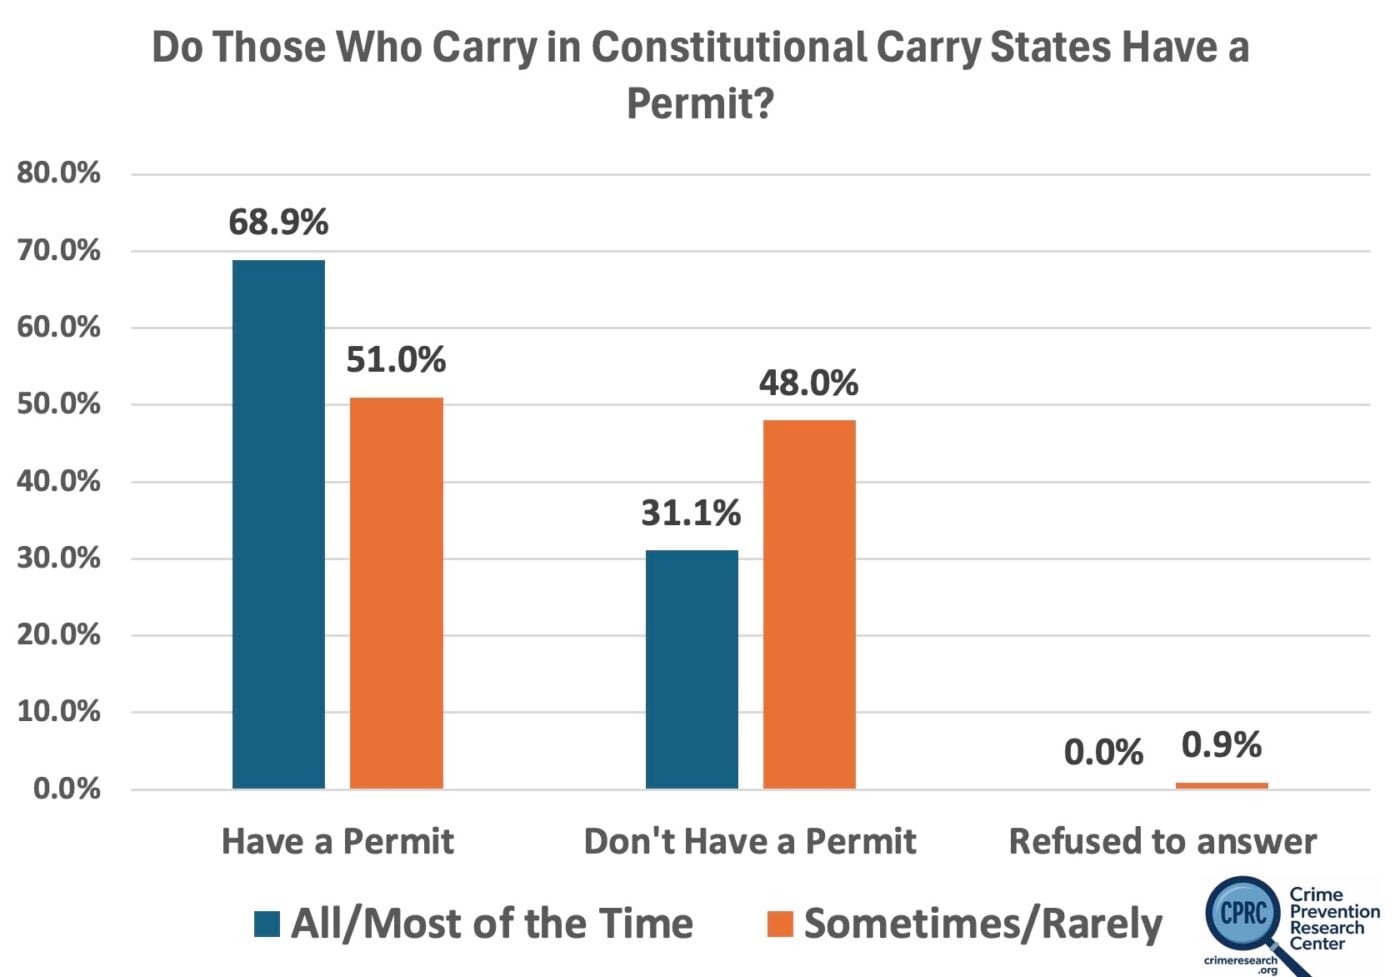
Over two-thirds of those who carry all or most of the time (68.9%) of people in Constitutional Carry states have a concealed handgun permit. Those who carry less frequently are less likely to have a permit (51.0%).
The demographics of those who carry concealed handguns are striking. Hispanic and Black general election voters carry at substantially higher rates than White or Asian voters. Among those who carry all or most of the time, Hispanics and Blacks are 2.6 times more likely than Whites to do so.
Young adults also carry at much higher rates than older adults. Voters between the ages of 18 and 40 carry all or most of the time at rates at least ten times higher than those over age 65.
Women also carry at rates close to those of men. Overall, 29.7% of women report carrying at least rarely, compared with 32.2% of men.
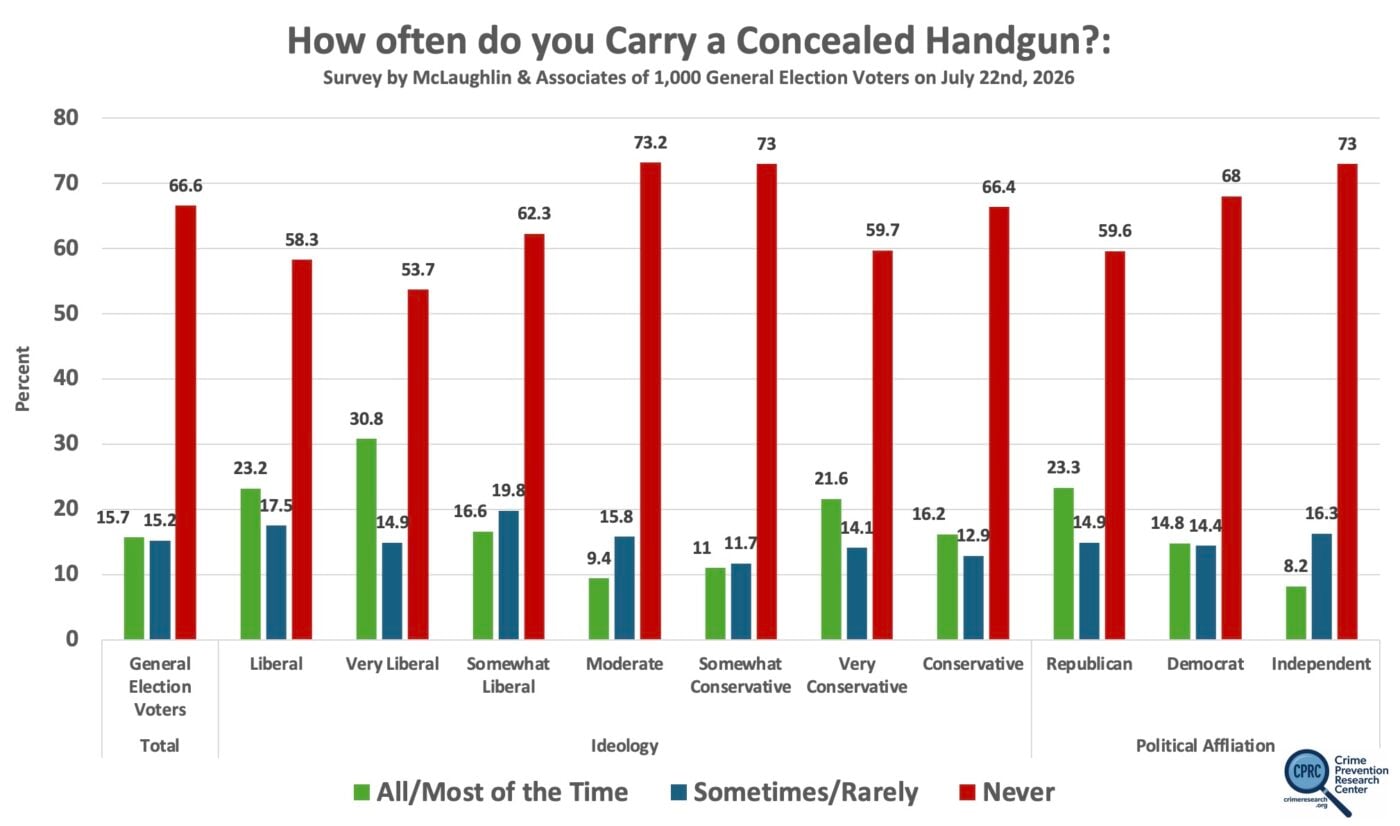
The breakdown by ideology and political affiliation is particularly interesting. Republicans are much more likely than Democrats to carry concealed handguns all or most of the time (23.3% versus 14.8%). However, when voters are grouped by ideology rather than party, those who identify as very liberal report the highest rate of carrying all or most of the time—30.8%, compared with 21.6% among very conservatives, the next-highest group. By contrast, moderates are the least likely to carry concealed handguns.
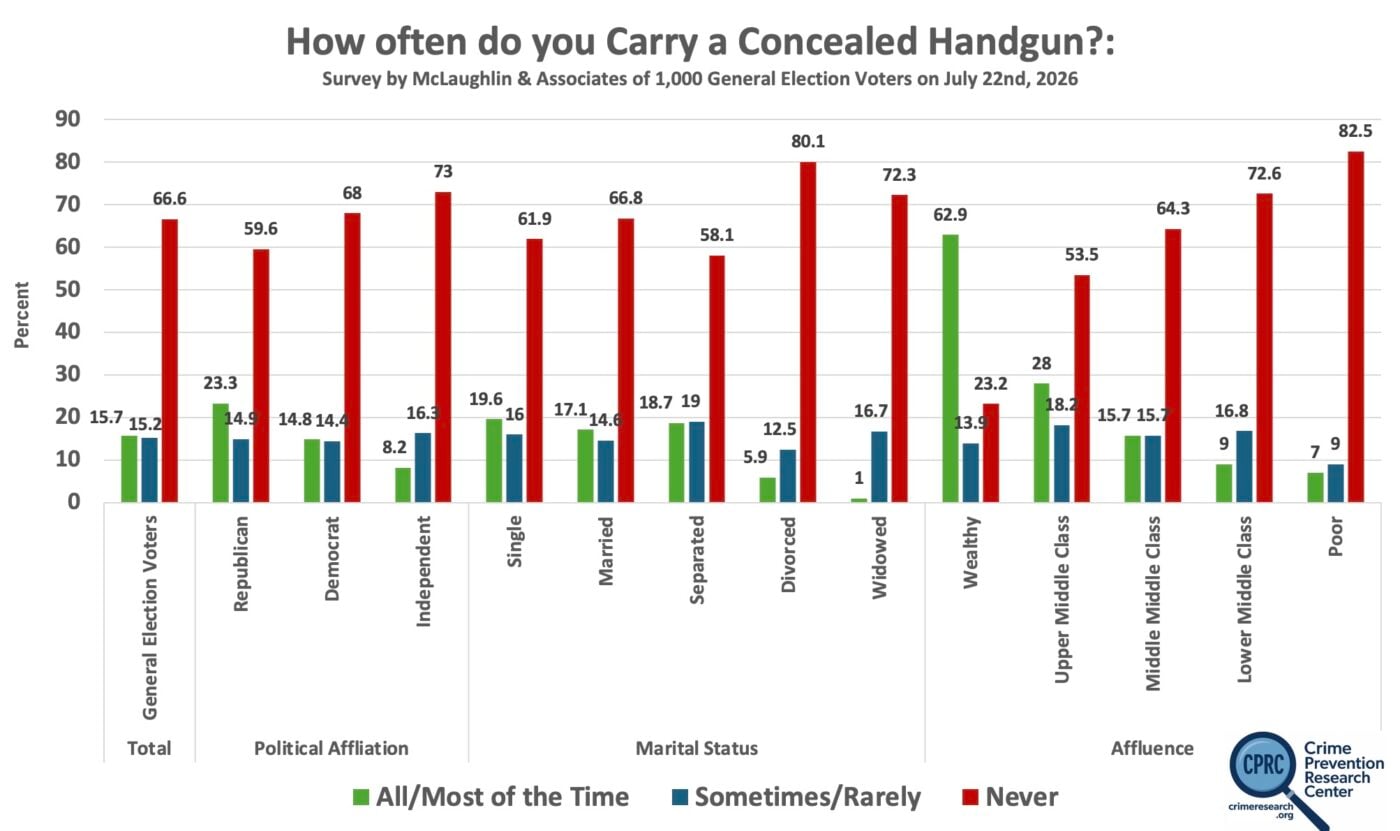
Finally, the strongest pattern among those who carry all or most of the time is the relationship between wealth and carrying. Wealthy general election voters report by far the highest rate of carrying, with an astounding 62.9% saying they carry all or most of the time. Upper-middle-class voters rank a distant second at 28%. As wealth increases, so does the likelihood that a voter carries all or most of the time.



0 Comments