

| Comparing the number of murders in the first seven months of 2025 to the same time in 2026: FBI Crime Data Explorer Data Discovery Tool | ||||
| Month | 2025 | 2026 | Coverage gap in 2026 in percent of the population covered in percentage points | Percent Drop in Homicides Comparing the same months in 2025 to 2026 after adjusting for the coverage gap |
| 1 | 1182 | 933 | 5.76 | Down 16.1% for the first month |
| 2 | 1048 | 809 | 5.98 | Down 16.8% for the first two months |
| 3 | 1139 | 939 | 7.07 | Down 14.9% for the first three months |
| 4 | 1205 | 881 | 9.12 | Down 16.1% for the first four months |
| 5 | 1246 | 912 | 11.14 | Down 16.3% for the first five months |
| 6 | 1299 | 905 | 12.02 | Down 17.1% for first six months |
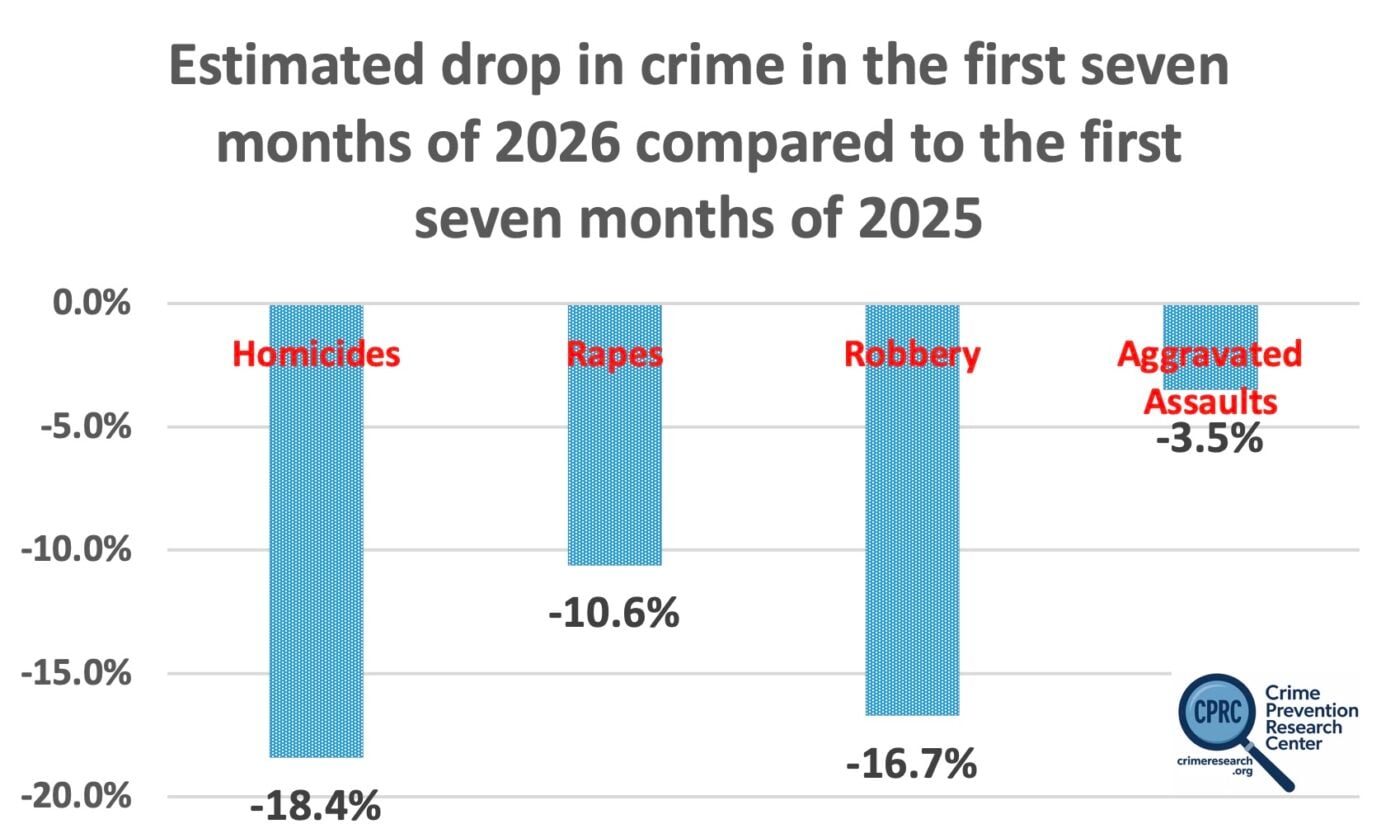
| 7 | 1308 | 823 | 14.89 | Down 18.4% for first seven months |
The FBI Crime Data Explorer’s Data Discovery Tool tracks crimes reported to police. So far, agencies submitting data for 2026 cover a smaller share of the population than those reporting in 2025. Because many police departments take time to submit their data to the FBI, we adjusted each month’s 2026 crime totals to account for the lower population coverage.
The Bureau of Justice Statistics’ National Crime Victimization Survey (NCVS) measures something different. While the FBI counts crimes reported to police, the NCVS estimates total crime, including crimes that victims never report to police. Homicide differs from the other major crime categories because authorities detect the vast majority of homicides, while victims do not report most crimes in many other categories to police.
Before 2020, changes in FBI reported-crime data and NCVS total-crime violent crime estimates were generally slightly positively correlated with each other. Unfortunately, the NCVS releases its data much later than the FBI releases Crime Data Explorer data. Indeed, BJS has not yet released the NCVS estimates for 2025, so while the NCVS data provides a much more accurate measure of what is happening to crime, we only have the FBI data to get an estimate on how crime is changing so far this year compared to last year.
The number of homicides for the first seven months of 2026 declined compared to 2025 by 18.4%. If that drop persists for the full year, it would imply a murder rate for the year of 3.36 per 100,000 people. The rate in 2024 was 5.1 per 100,000, and dropping in 2025 to 4.121, tied for the lowest rate ever since the federal government started recording the data in 1900. The two previous lowest rates were 4.169 per 100,000 in 1955 (6,850 murders and a population of 164,308,000) and 4.166 per 100,000 in 1956 (6,970 murders and a population of 167,306,000). Just rounding to the first decimal place has the 2025 murder rate at 4.1 and for 1955 and 1956 it would be 4.2.
If we do not adjust for the fact that fewer jurisdictions are reporting data to the FBI in 2026 than in 2025, the apparent crime declines become even larger. Using the unadjusted figures, homicides fell 26.4% during the first seven months of 2026, 24.4% during the first six months, and 23.1% during the first five months.
But the decline in reporting coverage is substantial. For example, agencies reporting data for July 2025 covered 96.51% of the population, compared with only 81.62% in July 2026. Significant coverage gaps exist in each of the first nine months of 2026 compared with the same months in 2025.
For that reason, our estimates of the decline in crime adjust for differences in population coverage. They remain estimates, however, because we do not yet know precisely which jurisdictions reported data in each month of 2025 and 2026.
| Reporting gap for every month from January through September 2026 has compared with the same month in 2025 | |||
| Month | 2025 population coverage | 2026 population coverage | Coverage gap in 2026 |
| January | 96.95% | 91.19% | 5.76 percentage points |
| February | 96.64% | 90.66% | 5.98 percentage points |
| March | 96.86% | 89.79% | 7.07 percentage points |
| April | 96.82% | 87.70% | 9.12 percentage points |
| May | 96.78% | 85.64% | 11.14 percentage points |
| June | 96.74% | 84.72% | 12.02 percentage points |
| July | 96.51% | 81.62% | 14.89 percentage points |
| August | 96.34% | 75.07% | 21.27 percentage points |
| September | 96.45% | 52.43% | 44.02 percentage points |
| *Unfortunately, while the FBI’s current public Crime Data Explorer provides agency-level monthly offense data, it has decommissioned the convenient agency-participation API that previously allowed researchers to download a ready-made list of reporting agencies for each month. Reconstructing a matched set of reporting jurisdictions for 2025 and 2026 would therefore require a much more cumbersome agency-by-agency analysis. For an idea of what would be involved in doing that, there are roughly 19,636 Originating Agency Identifiers (ORIs) in the current Crime Data Explorer agency roster. | |||
The number of reported rapes and robberies during the first six months of the year were also down by double digit numbers of 10.6% and 16.7% respectively. Reported aggravated assaults was only down by 2.7%.
| Comparing the number of rapes in the first seven months of 2025 to the same time in 2026: FBI Crime Data Explorer Data Discovery Tool | ||||
| Month | 2025 | 2026 | Coverage gap in 2026 in percent of the population covered in percentage points | Percent Drop in the number of Rapes comparing the same months in 2025 to 2026 after adjusting for the coverage gap |
| 1 | 10012 | 8780 | 5.76 | Down 6.8% for the first month |
| 2 | 9266 | 8105 | 5.98 | Down 6.8% for the first two months |
| 3 | 11047 | 9392 | 7.07 | Down 7.3% for the first three months |
| 4 | 10970 | 8966 | 9.12 | Down 8.0% for the first four months |
| 5 | 11437 | 8704 | 11.14 | Down 9.3% for the first five months |
| 6 | 10667 | 8070 | 12.02 | Down 10.0% for first six months |
| 7 | 10844 | 7873 | 14.89 | Down 10.6% for first seven months |
| Comparing the number of robberies in the first seven months of 2025 to the same time in 2026: FBI Crime Data Explorer Data Discovery Tool | ||||
| Month | 2025 | 2026 | Coverage gap in 2026 in percent of the population covered in percentage points | Percent Drop in the number of Robberies Comparing the same months in 2025 to 2026 after adjusting for the coverage gap |
| 1 | 14531 | 10782 | 5.76 | Down 21.1% for the first month |
| 2 | 12401 | 9763 | 5.98 | Down 18.8% for the first two months |
| 3 | 13267 | 10642 | 7.07 | Down 17.0% for the first three months |
| 4 | 13657 | 10339 | 9.12 | Down 16.9% for the first four months |
| 5 | 15150 | 11214 | 11.14 | Down 16.8% for the first five months |
| 6 | 14340 | 10478 | 12.02 | Down 16.7% for first six months |
| 7 | 14799 | 10423 | 14.89 | Down 16.7% for first seven months |
| Comparing the number of aggravated assaults in the first seven months of 2025 to the same time in 2026: FBI Crime Data Explorer Data Discovery Tool | ||||
| Month | 2025 | 2026 | Coverage gap in 2026 in percent of the population covered in percentage points | Percent Drop in the number of Aggravated Assaults Comparing the same months in 2025 to 2026 after adjusting for the coverage gap |
| 1 | 59450 | 54875 | 5.76 | Down 1.9% for the first month |
| 2 | 54572 | 50853 | 5.98 | Down 1.3% for the first two months |
| 3 | 66526 | 60286 | 7.07 | Down 1.6% for the first three months |
| 4 | 67569 | 59224 | 9.12 | Down 2.1% for the first four months |
| 5 | 72535 | 63332 | 11.14 | Down 1.9% for the first five months |
| 6 | 71351 | 58705 | 12.02 | Down 2.7% for first six months |
| 7 | 73625 | 57199 | 14.89 | Down 3.5% for first seven months |


0 Comments