

The CPRC hired McLaughlin & Associates to survey 1,000 general election voters on May 19th, 2026 (cross tabs available here), regarding whether likely voters carry concealed handguns. In the survey, 13.2% carry all/most of the time, with another 16.6% carrying sometimes/rarely. The percent who carry all or most the time is virtually the same as the percent who carried similarly in December 2024. But the percent who carry at last some of the time or rarely has increase by 5.4 percentage points (from 11.2% to 16.6%). So the total who are carrying increased by 5.5 percentage points (from 24.3% to 29.8%).
Not surprisingly, people in the 29 constitutional-carry states carry concealed handguns more frequently (34.2%) than people in 21 right-to-carry states (25.98%).
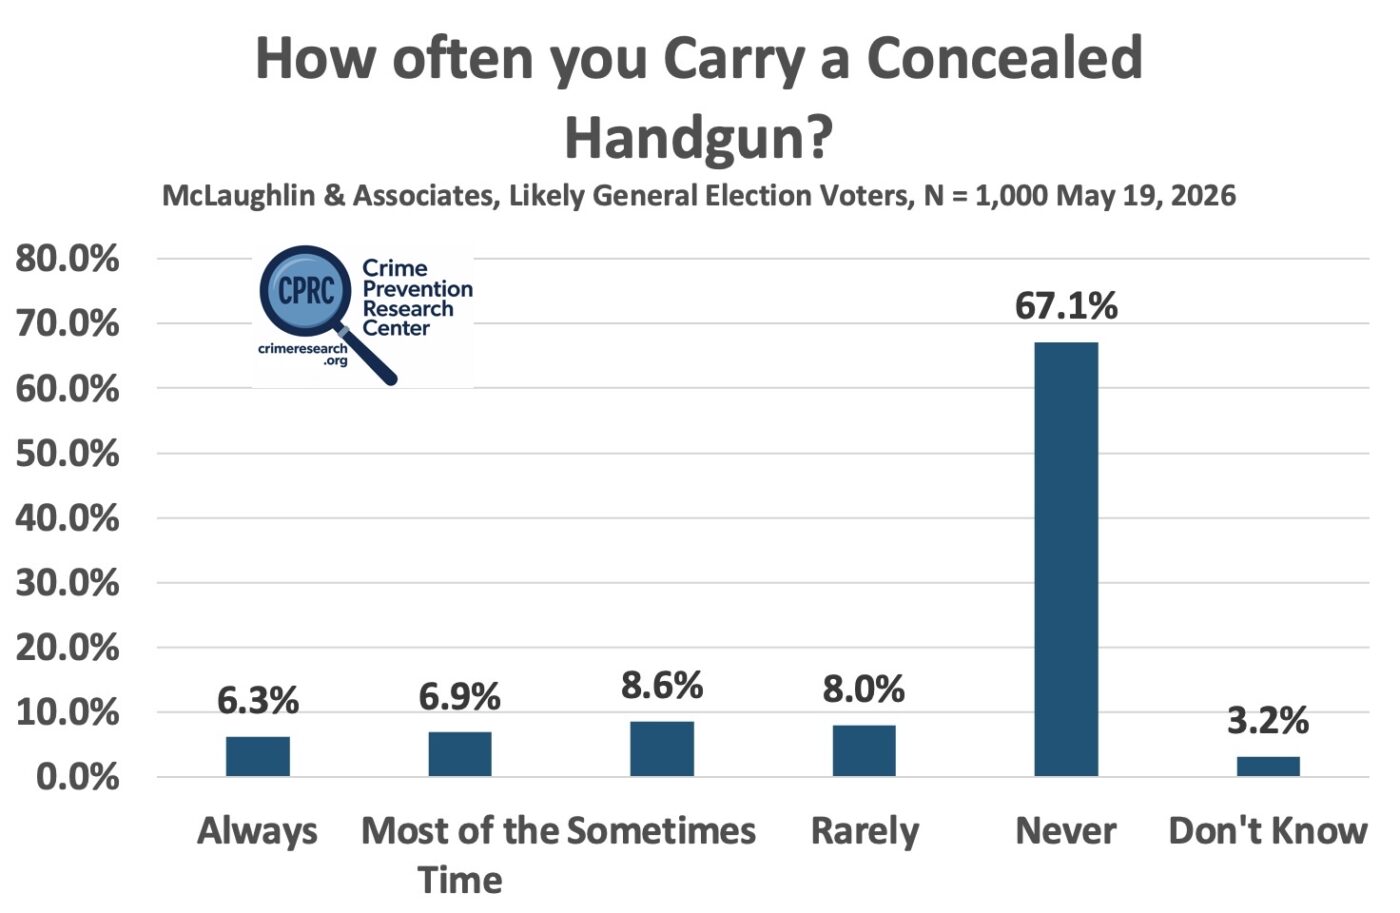
We can break the numbers down more finely. The share of people who carry a gun all or most of the time stayed within one percentage point of its 2024 level. However, the shares who carry sometimes or rarely both increased by about 2.5 to 2.9 percentage points in 2026 compared with 2024.
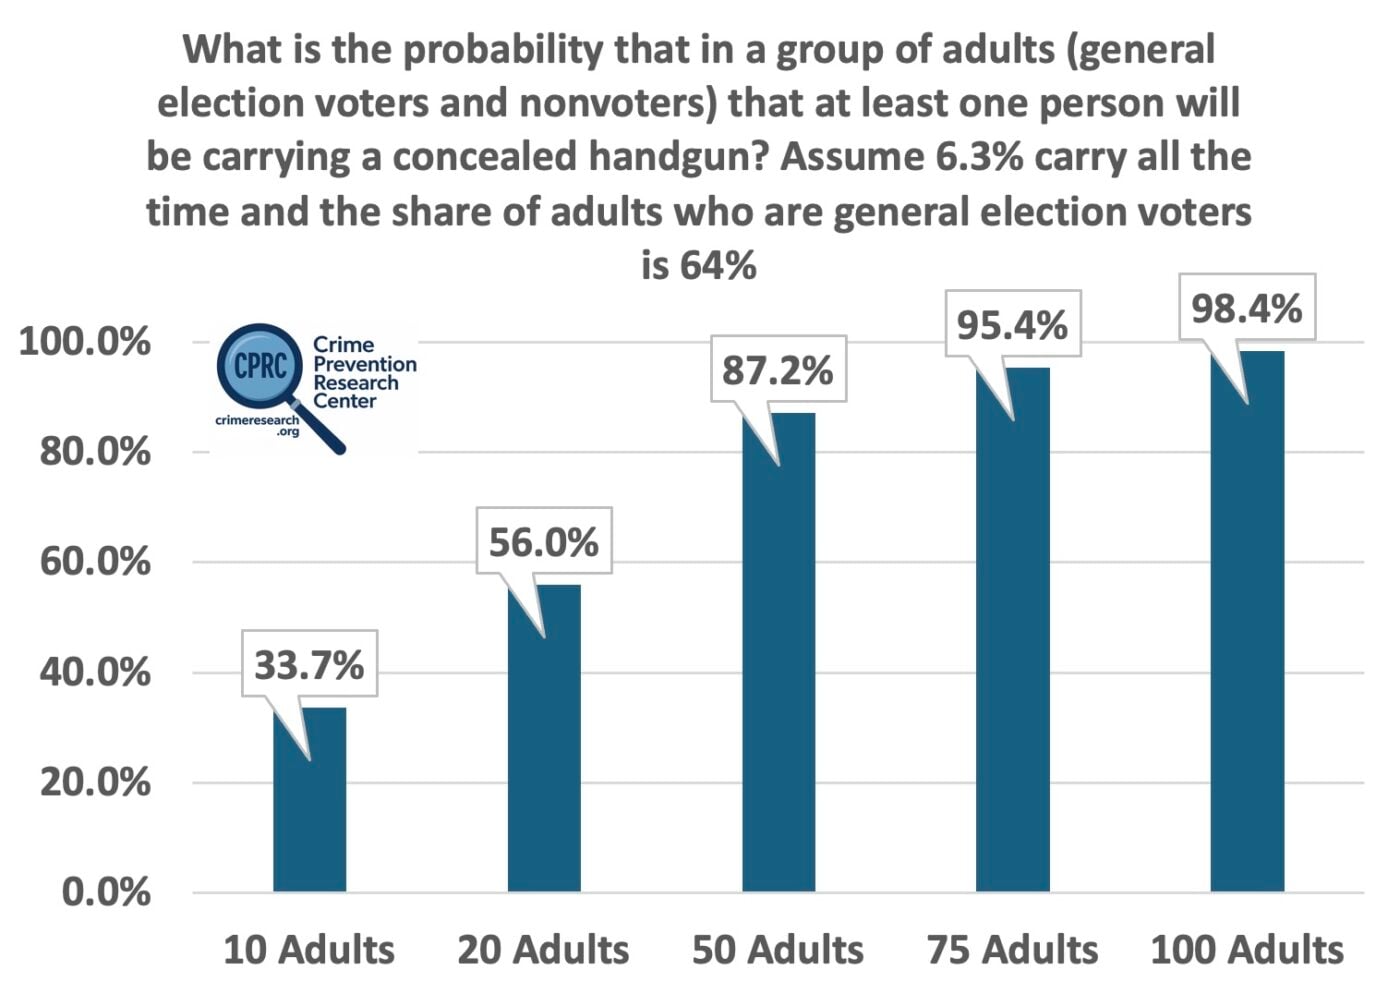
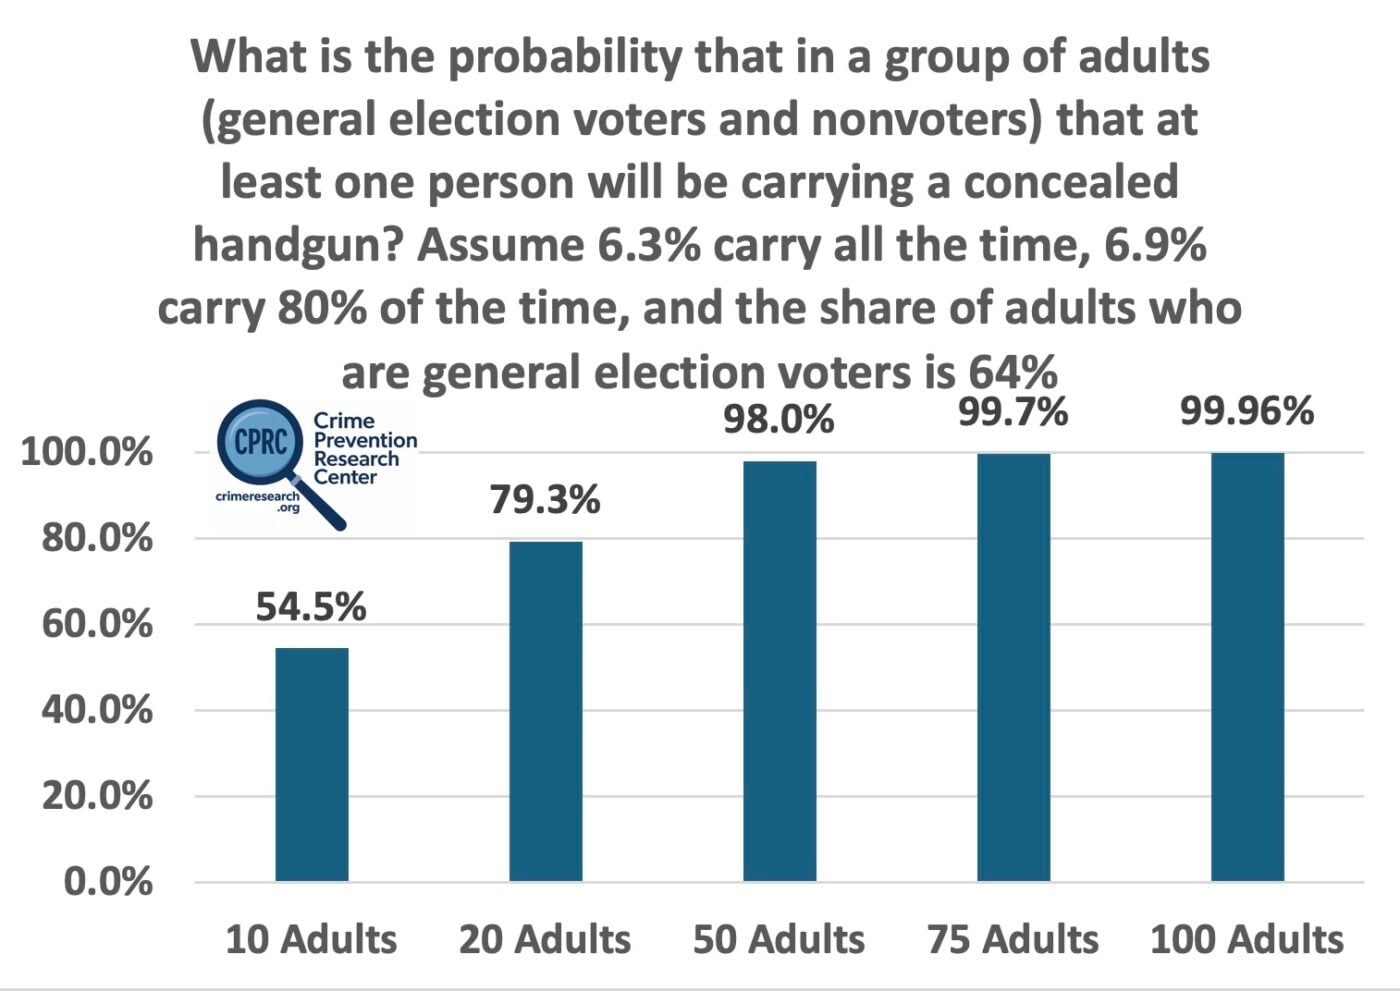
So what are the odds that if someone attacks a group of adults in public that at least one of the adults will have a concealed handgun in a venue that is not a gun-free zone. Assume that 6.3% of general election voters carry all the time and 64% of adults are general election voters, what is the probability that at least some in a group of adults will be carrying a concealed handgun. The formula is: P(at least one) = 1 – (1 – (0.64 * 0.063))n, where n is the number of adults in the area. If you assume that 6.3% carry all the time and 6.9% carry 80% of the time, the formula is: P(at least one) = 1 – (1 – ((0.063+(0.069×0.80))*0.64))n. These formulas assume that the probability that any one adult is carrying is independent of whether others are carrying. Obviously, if you are at an NRA convention that won’t be the case or if you are at a gun control convention, though as we will see later there are some surprising groups that tend to carry at relatively high rates.
Twenty percent of likely voters hold a concealed handgun permit (20.2%), over double the rate for adults overall (8%). Constitutional Carry states have only a slightly higher permit rate than pure Right-to-Carry states (21.38% versus 19.81%). However, our research suggests this gap will narrow over time because the share of adults with permits is declining in Constitutional Carry states while rising in pure Right-to-Carry states.
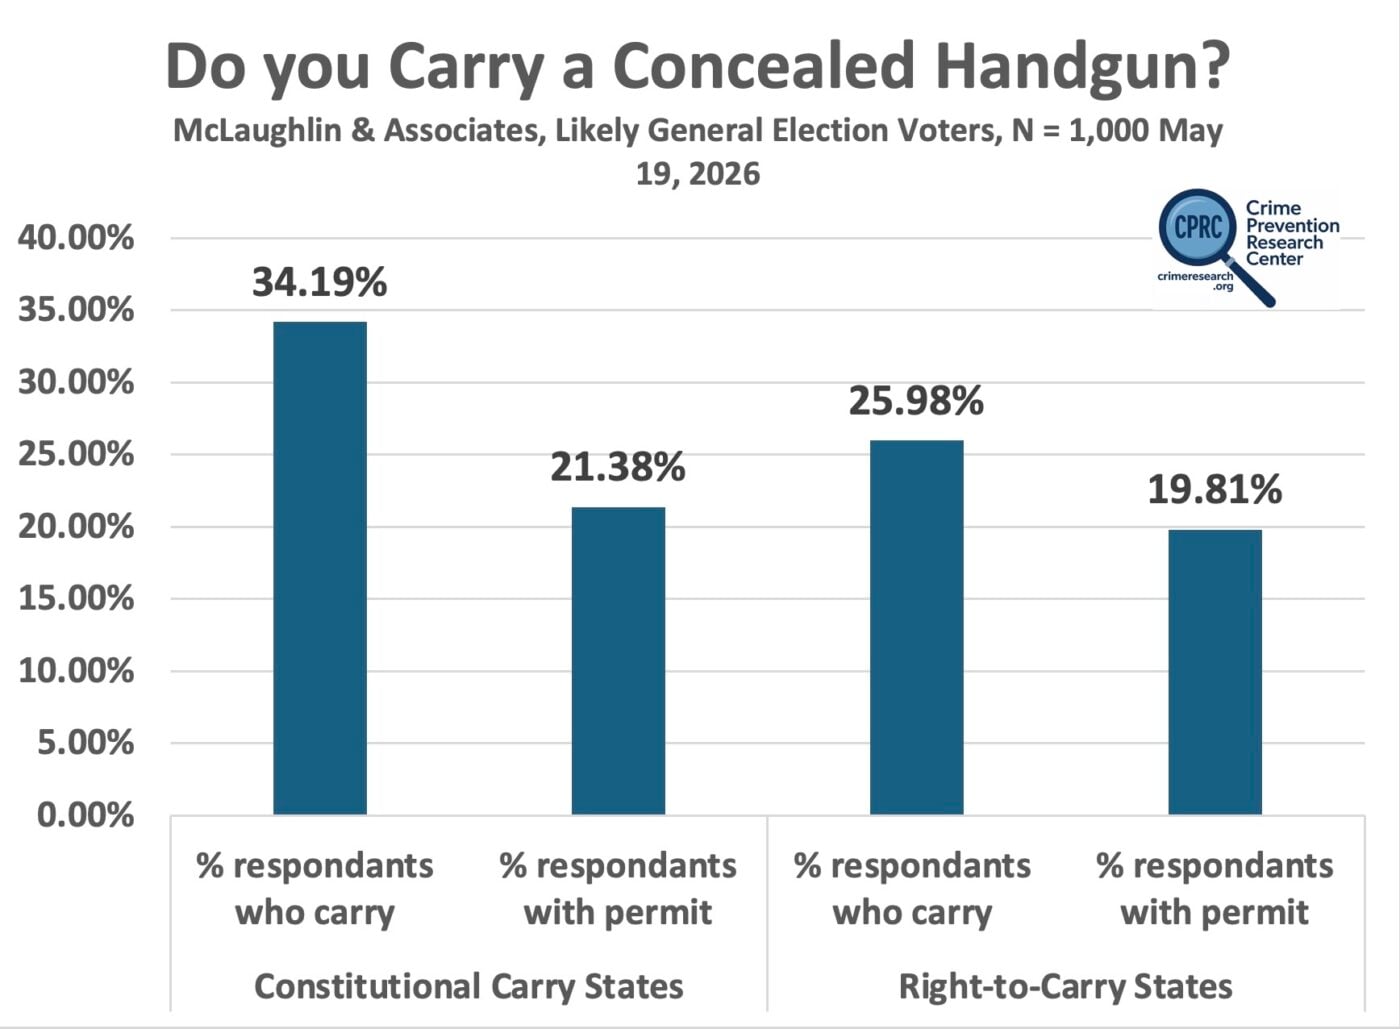
Interestingly, people in Constitutional Carry states carry handguns at much higher rates than those in pure Right-to-Carry states (34.19% versus 25.98%). In Constitutional Carry states, the share of likely voters who carry exceeds the share with permits by about 13 percentage points. In the other pure Right-to-Carry states, the share who carry exceeds the share with permits by about six percentage points. So Constitutional Carry laws result in about seven percentage points more people carrying than have a permit.
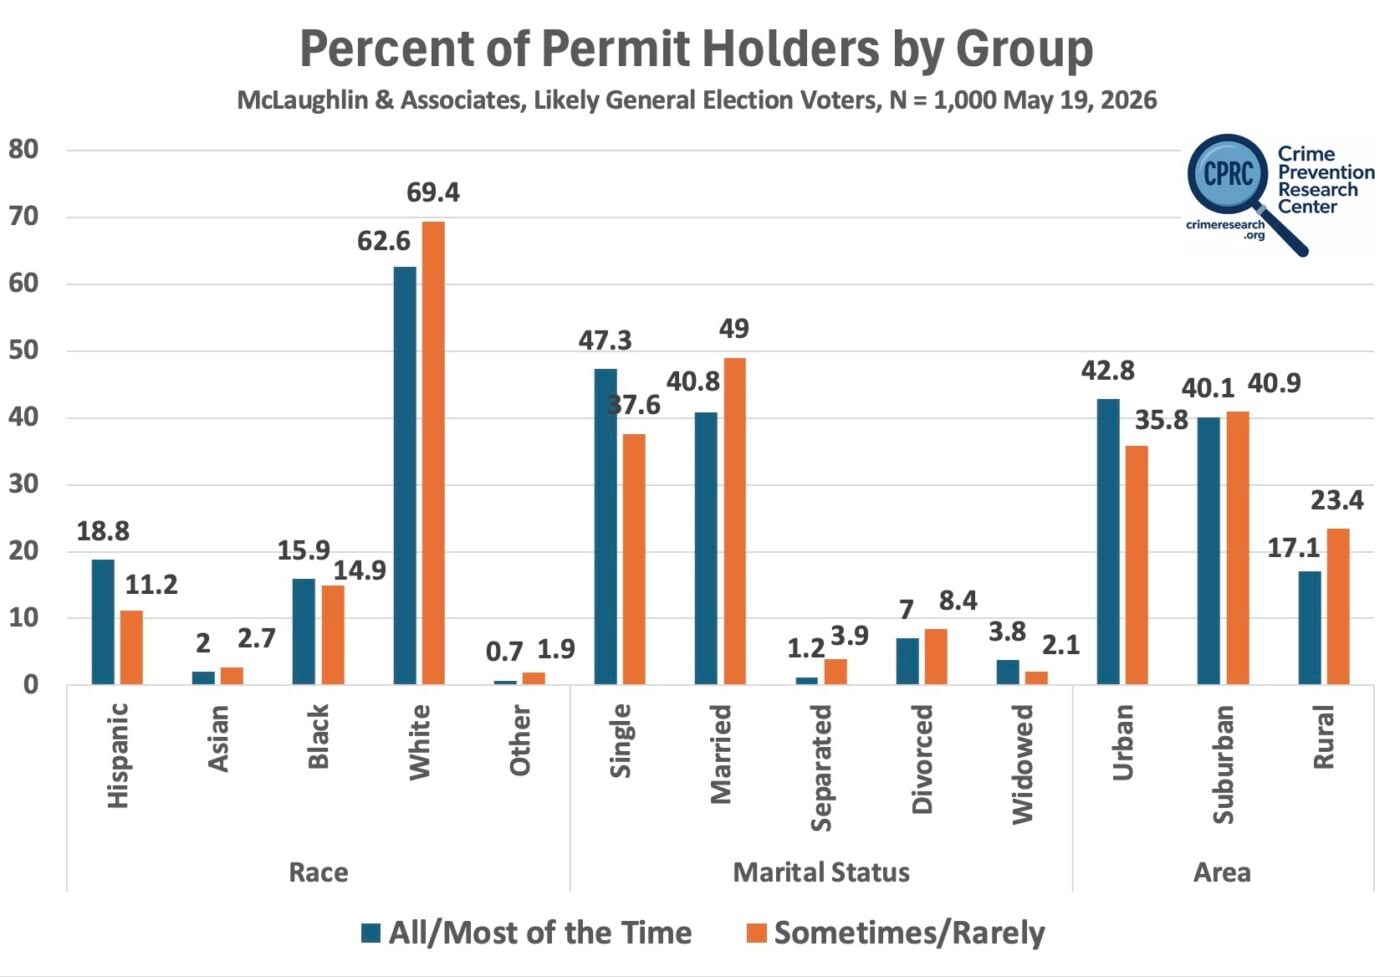
Blacks account for 11.0% of likely voters, but they represent 15.9% of those who carry all or most of the time. Hispanics also carry at disproportionately high rates, making up 18.8% of those who carry all or most of the time despite accounting for only 11.0% of likely voters. By contrast, whites and Asians carry at rates below their shares of likely voters. Whites make up 72.0% of likely voters but only 62.6% of those who carry all or most of the time, while Asians account for 4.0% of likely voters but just 2.0% of frequent carriers.
Interestingly, urban residents carry at rates well above their share of likely voters. Although urban residents make up 31.3% of likely voters, they account for 42.8% of those who carry frequently and 35.8% of those who carry sometimes or rarely. Suburban residents account for nearly the same share of carriers as their share of likely voters (41.0%). By contrast, rural residents carry frequently at rates well below their 23.3% share of likely voters.
Singles also make up a much larger share of frequent carriers than their share of likely voters. Singles account for 47.3% of those who carry frequently, compared with 37.6% of likely voters overall. Married people, by contrast, make up nearly identical shares of both groups, accounting for 40.8% of frequent carriers and 41.0% of likely voters.
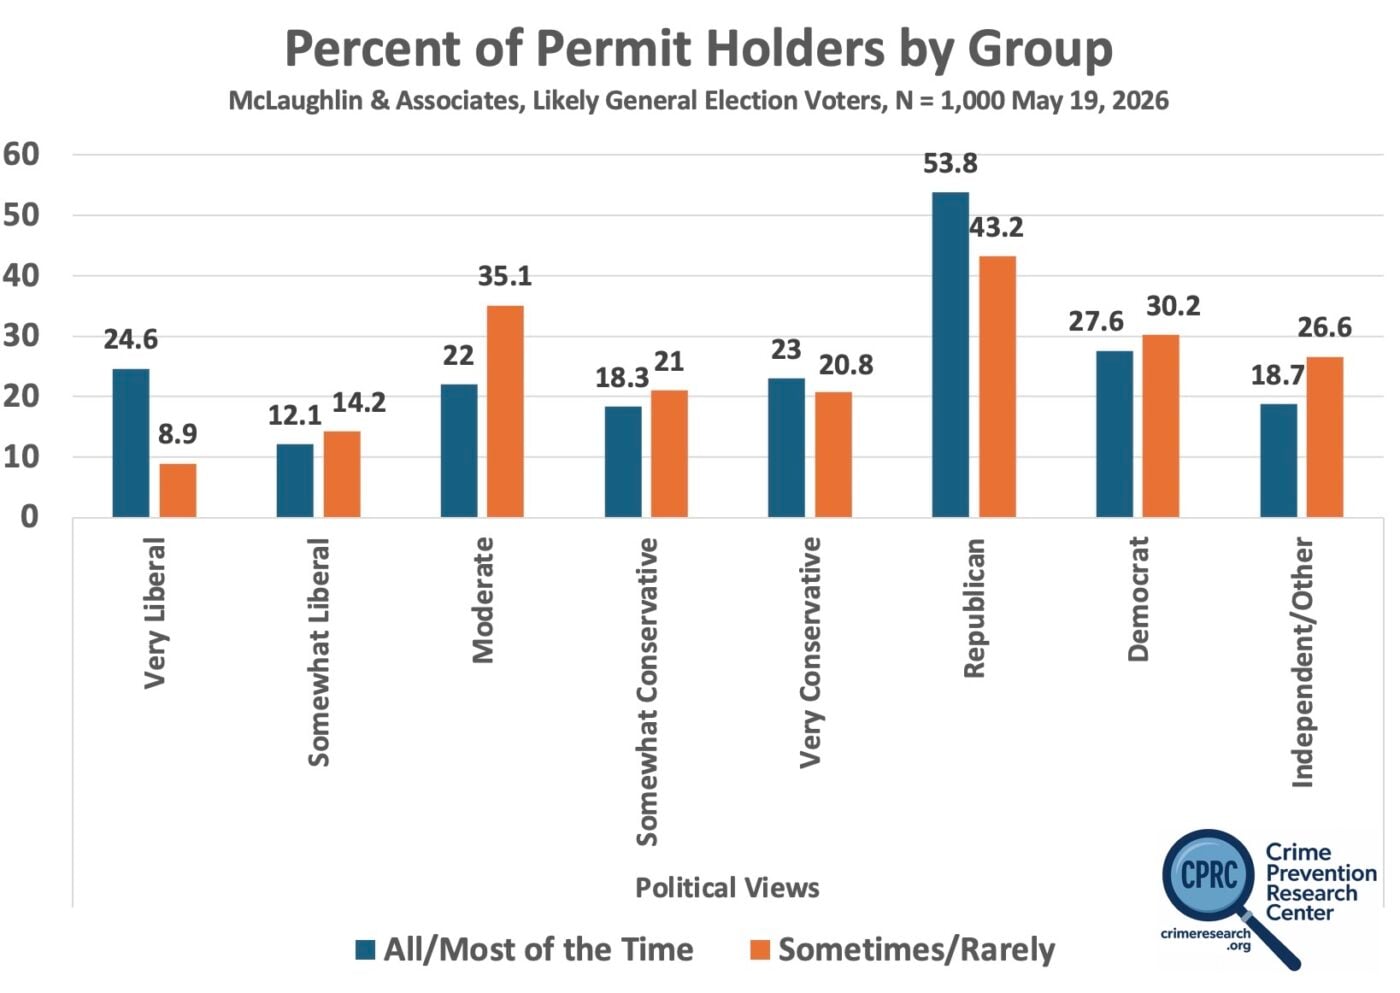
Very liberal and very conservative likely voters carry frequently at disproportionately high rates relative to their shares of the population. Very liberal voters account for 24.6% of frequent carriers even though they make up only 12.9% of likely voters. Similarly, very conservative voters account for 23.0% of frequent carriers while making up 18.0% of likely voters.
Republicans also carry frequently at disproportionately high rates, while Democrats and Independents/Other carry at relatively lower rates. Republicans make up 35.0% of likely voters, compared with 34.0% for Democrats and 31.0% for Independents/Other.
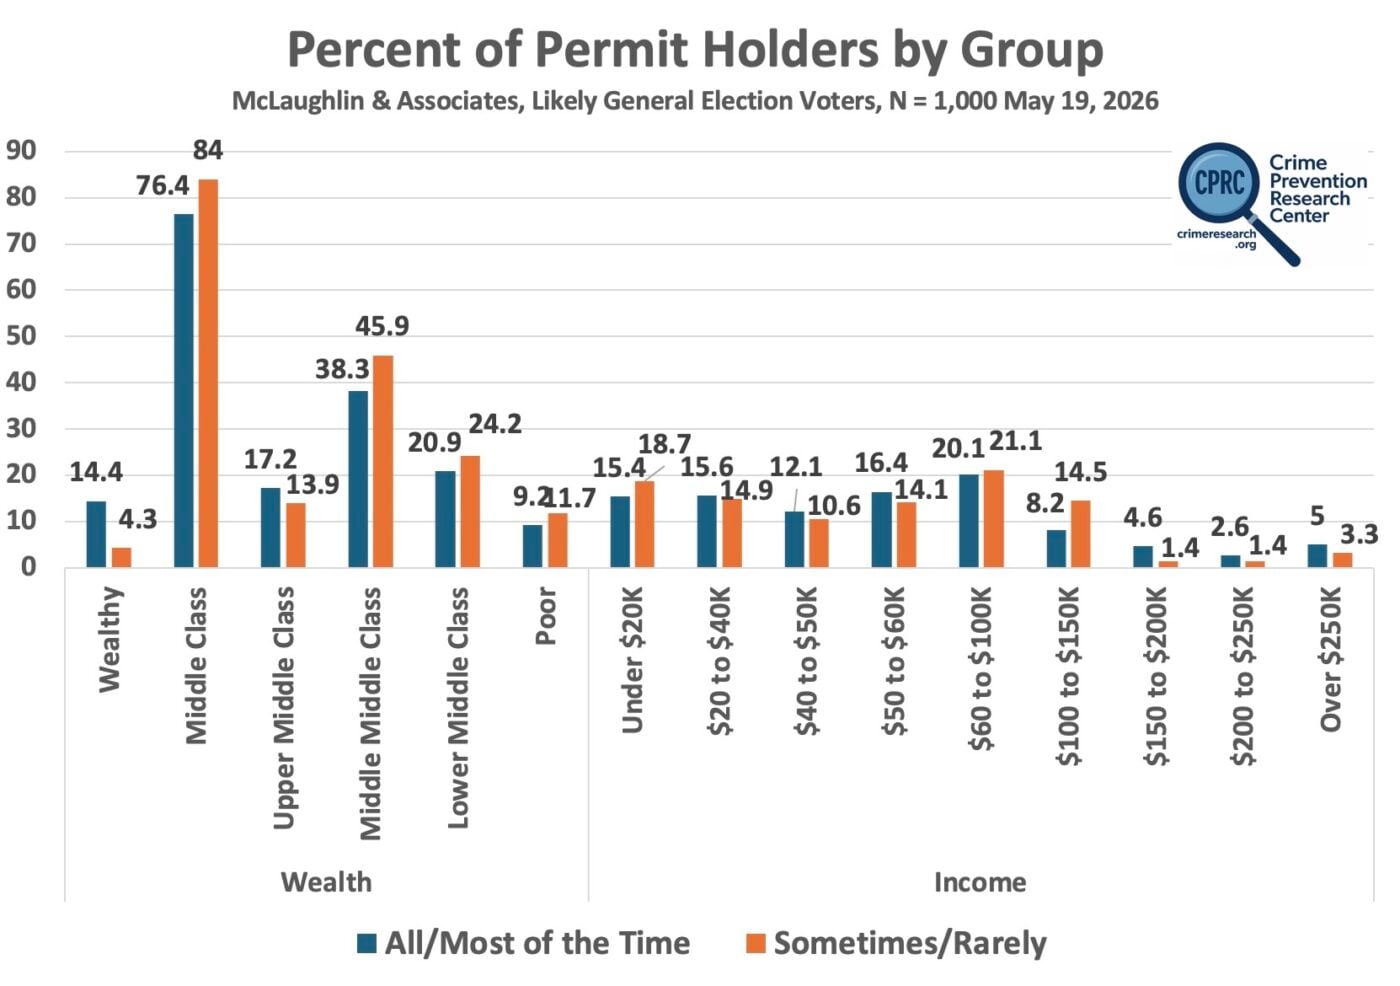
The percent of likely voters who self-identified as affluence levels were: Wealthy: 3.3%,Upper middle class: 9.9%, Middle class: 41.4%, Lower middle class: 27.8%, and Poor: 17.5%. The income breakdown for likely voters was: Under $20,000: 18.9%, $20,000–$40,000: 20.7%, $40,000–$50,000: 9.2%, $50,000–$60,000: 12.8%, $60,000–$100,000: 19.8%, $100,000–$150,000: 10.4%, $150,000–$200,000: 4.2%, $200,000–$250,000: 1.4%, and Over $250,000: 2.7%.
So the wealthy and upper middle class make up a larger share of those who carry than their share of likely voters. The poor are dramatically unrepresentative in their share of carrying concealed handguns. Those over $250,000 income were also disproportionately carrying and those under $40,000 were disproportionately low.
While women make up 52% of general election voters and men make up 48%, men make up 54.9% of those who carry all or most of the time and women make up 45.1%, so men are over represented, though the gap isn’t as large as one might normally think. The breakdown between Constitutional Carry states is relatively higher for women, with 47.5% of those carrying all/most of the time are women and 52.5% are men.


0 Comments