

Here is some updated information on the characteristics of mass public shooters. Including some information from the Covenant school shooter on March 27, 2023. Here is also an Excel file with even more detailed information. Also, here is information on statements by these murderers that they pick gun-free zones (see also here). For information on the definition of “mass” and why the FBI includes public places and excludes cases involving other types of crimes, see here.
Between January 1st, 1998, and March 15th, 2023, 56.4% of attacks used solely handguns, and 14.9% used only rifles of any type—thirty-one percent of attacks used solely rifles or rifles in conjunction with another type of gun. Given the debate over pistol-stabilizing braces, the Excel file we provide lists the guns used in each attack, and two of the attacks used AR-15-type handguns with a pistol-stabilizing brace.
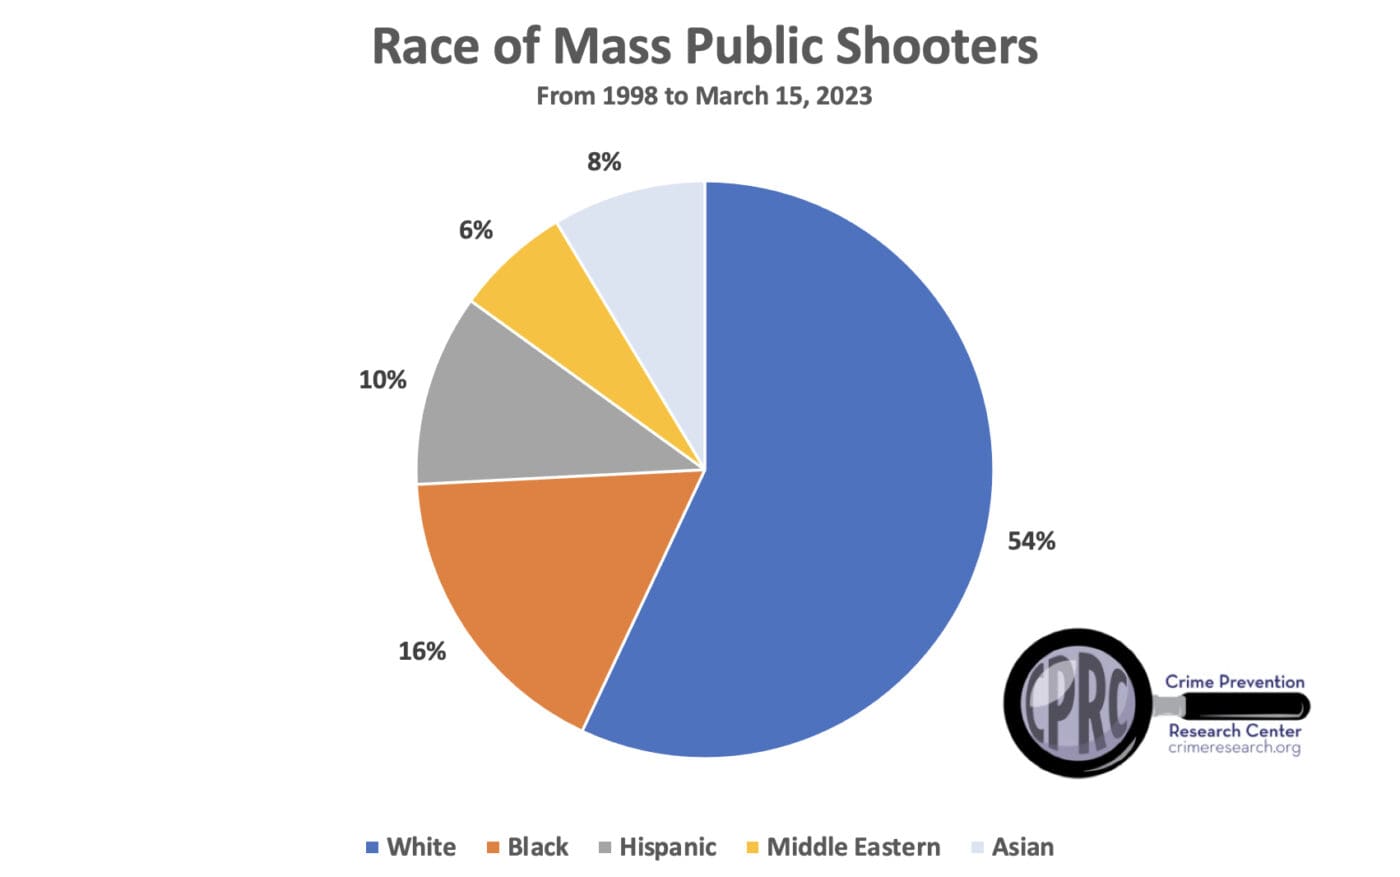
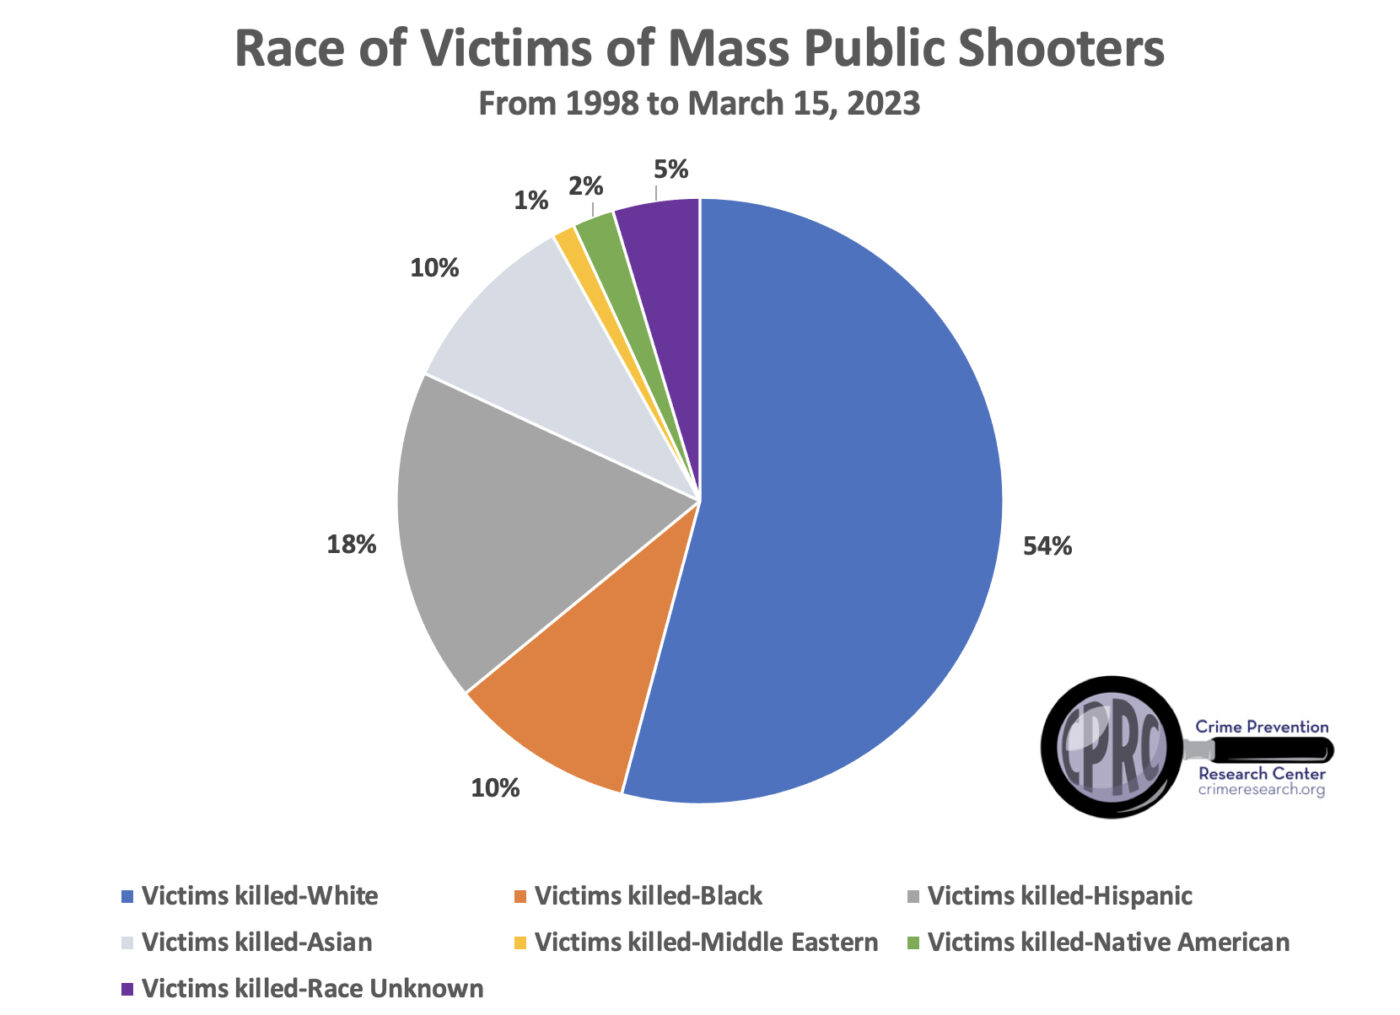
59.3% of the US population was non-Hispanic white in 2022, with 4% being Middle Eastern, so about 55.3% are non-Middle Eastern whites. With 54% of the murderers and victims being non-Middle Eastern whites, whites are slightly above their share of those involved in these attacks.
With all the discussions about the racial motives of shooters, blacks are underrepresented as a share of the victims. Blacks comprise 16% of the murderers but only 10% of the victims. That 10% is less than their 13.6% of the general population.
Hispanics are underrepresented as a share of mass murderers. 10% of these mass murderers are Hispanic compared to Hispanics, making up 18.9% of the general population. But their 18% share of the victims is close to Hispanics’ share of the general population.
Compared to Middle Easterners at 4% of the general population, they are overrepresented as a share of mass murderers (6%) and underrepresented in terms of victims (1%).
Asians make up 6.1% of the population, but they are overrepresented in both mass murderers (8%) and even more overrepresented as victims (10%). Interestingly, 44% of the Asians murdered in these attacks were murdered by other Asians.
From January 1st, 1998, to May 6th, 2023, 51% of mass murderers have seen mental health care professionals prior to the attacks.


0 Comments