

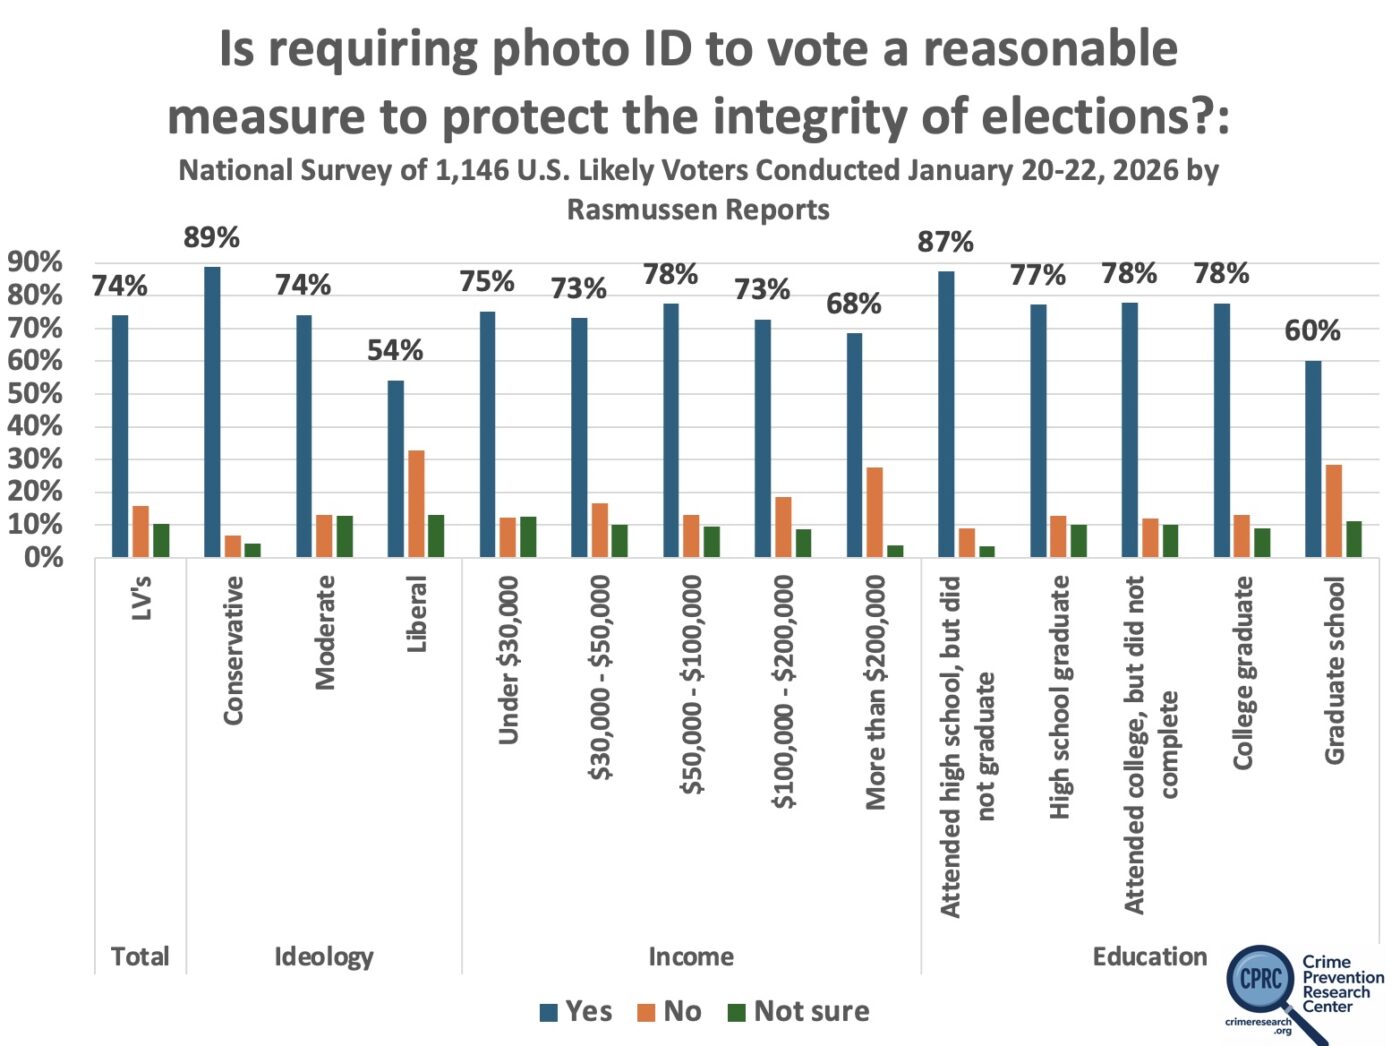
All groups of voters, even Democrats by a 65% to 23% margin and liberals by a 54% to 33% margin, support requiring government issued photo IDs from people to vote. Overall voters support requiring photo IDs by a 74% to 16% margin — a 4.63 times difference. Despite concerns that some people would be unable to vote, and Democrats claim it will be people with low socioeconomic status, those with the least education, those who didn’t even graduate from high school, were the strongest supporters (87% to 9% margin), while those with the most education, having gone to graduate school, were the least supportive (60% to 29% margin). Despite the fact that Democrats claim that minorities (blacks and Hispanics) are the most disenfranchised by requiring IDs to vote, blacks support IDs by a 69% to 14% margin and Hispanics by a 77% to 13% margin (a 64% gap that is even larger than the 58% margin for whites). Men and women are equally supportive of photo voter IDs, with 74% supporting it.
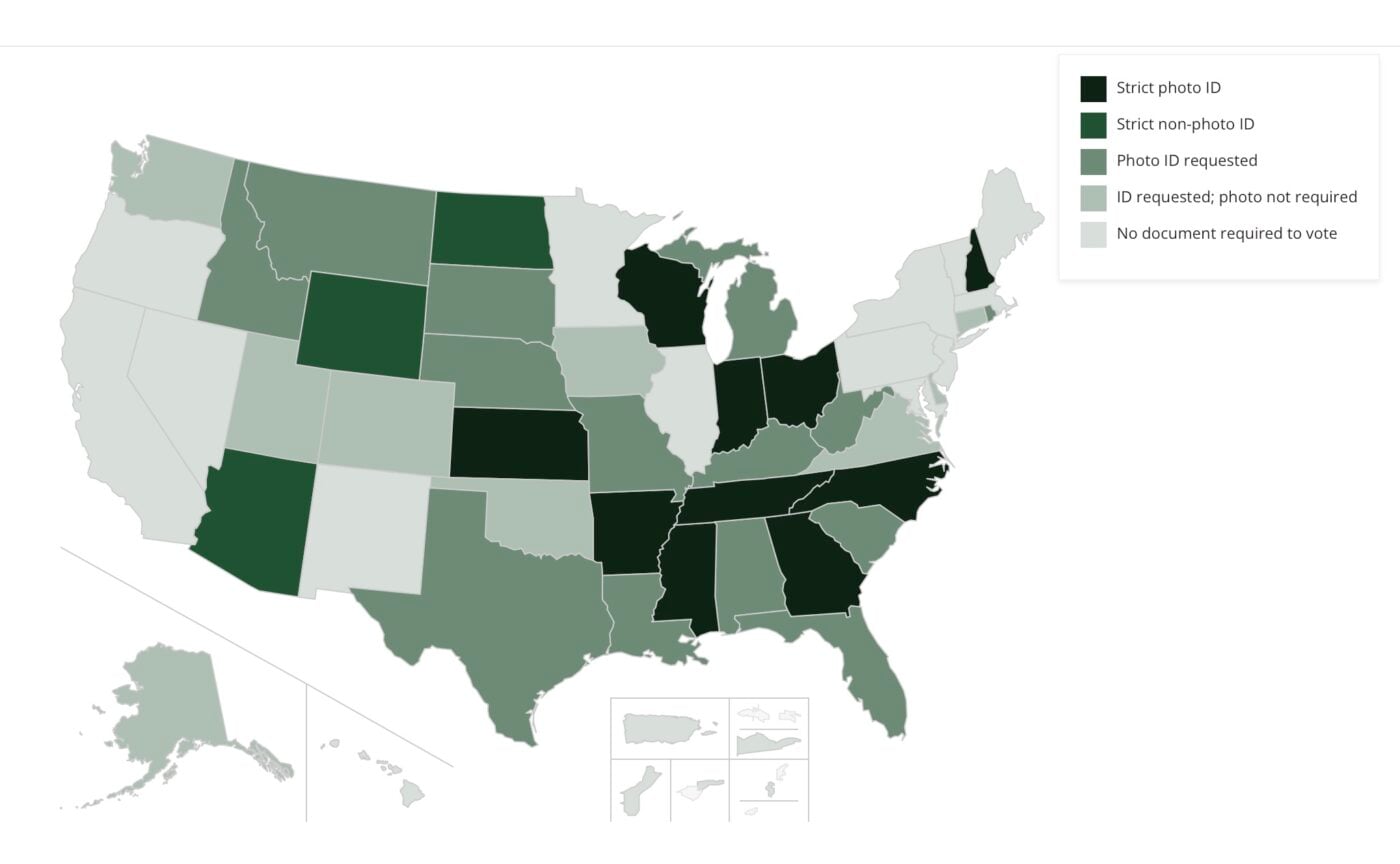
The National Conference of State Legislatures collects data on the voter ID requirements across states. Only ten states have “strict” voter ID requirements. Strict photo ID states require voters to affirmatively show acceptable photo identification to cast a regular ballot. If the voter can’t, their provisional ballot generally won’t be counted unless the ID is presented later. In Photo ID requested states voters are asked for a photo IDs, but alternatives are acceptable.
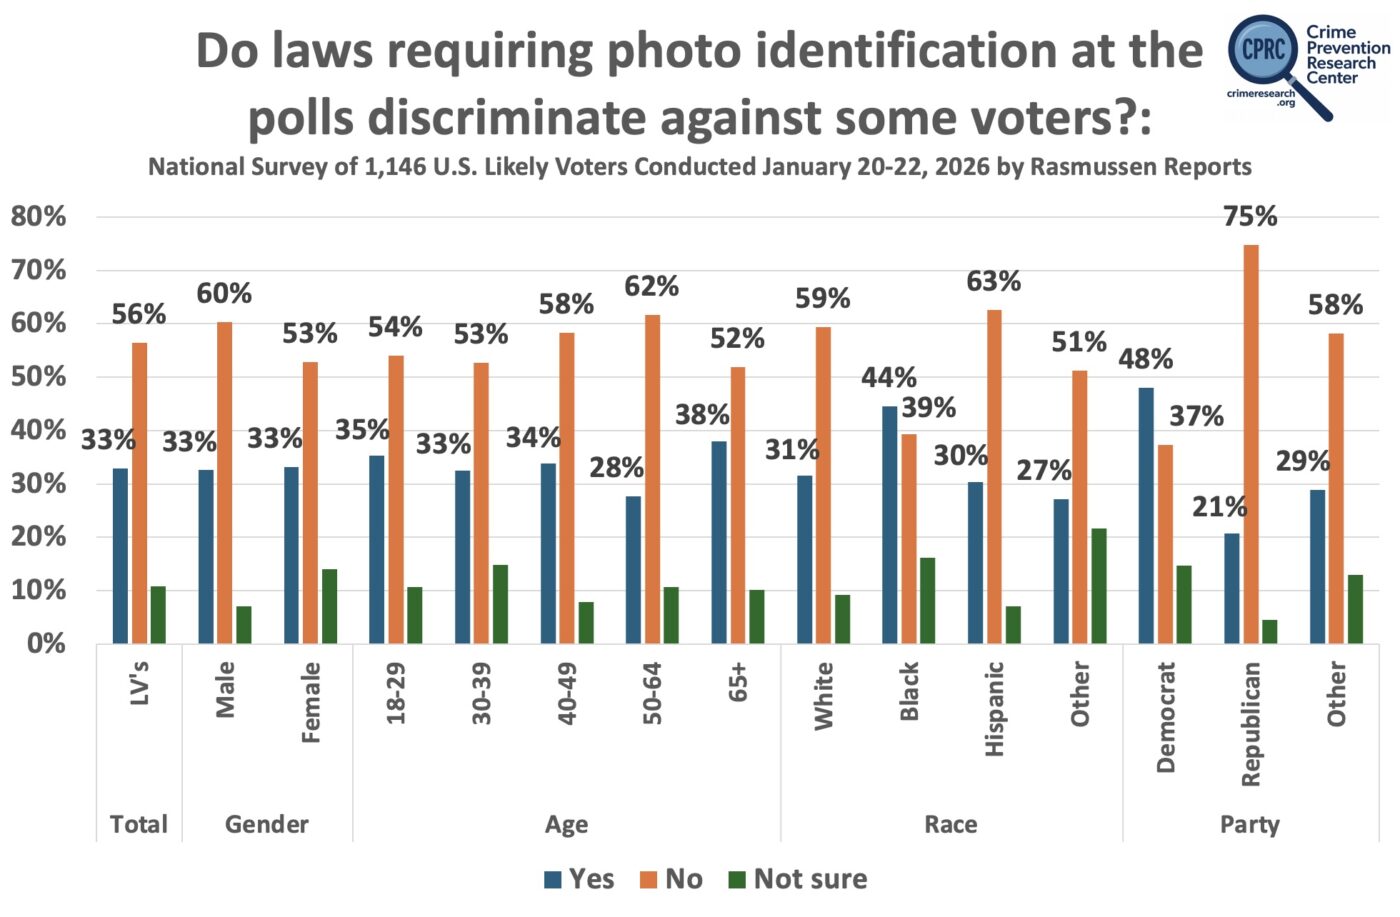
Rasmussen next asked whether photo ID laws discriminate against some voters. Likely voters said they do not, by a 56% to 33% margin. Men and women, people in every age group, all income levels, and all education levels largely agreed. However, blacks, Democrats, liberals, and those with graduate degrees, on net, said that these laws do discriminate against some voters—though they still support requiring photo IDs.
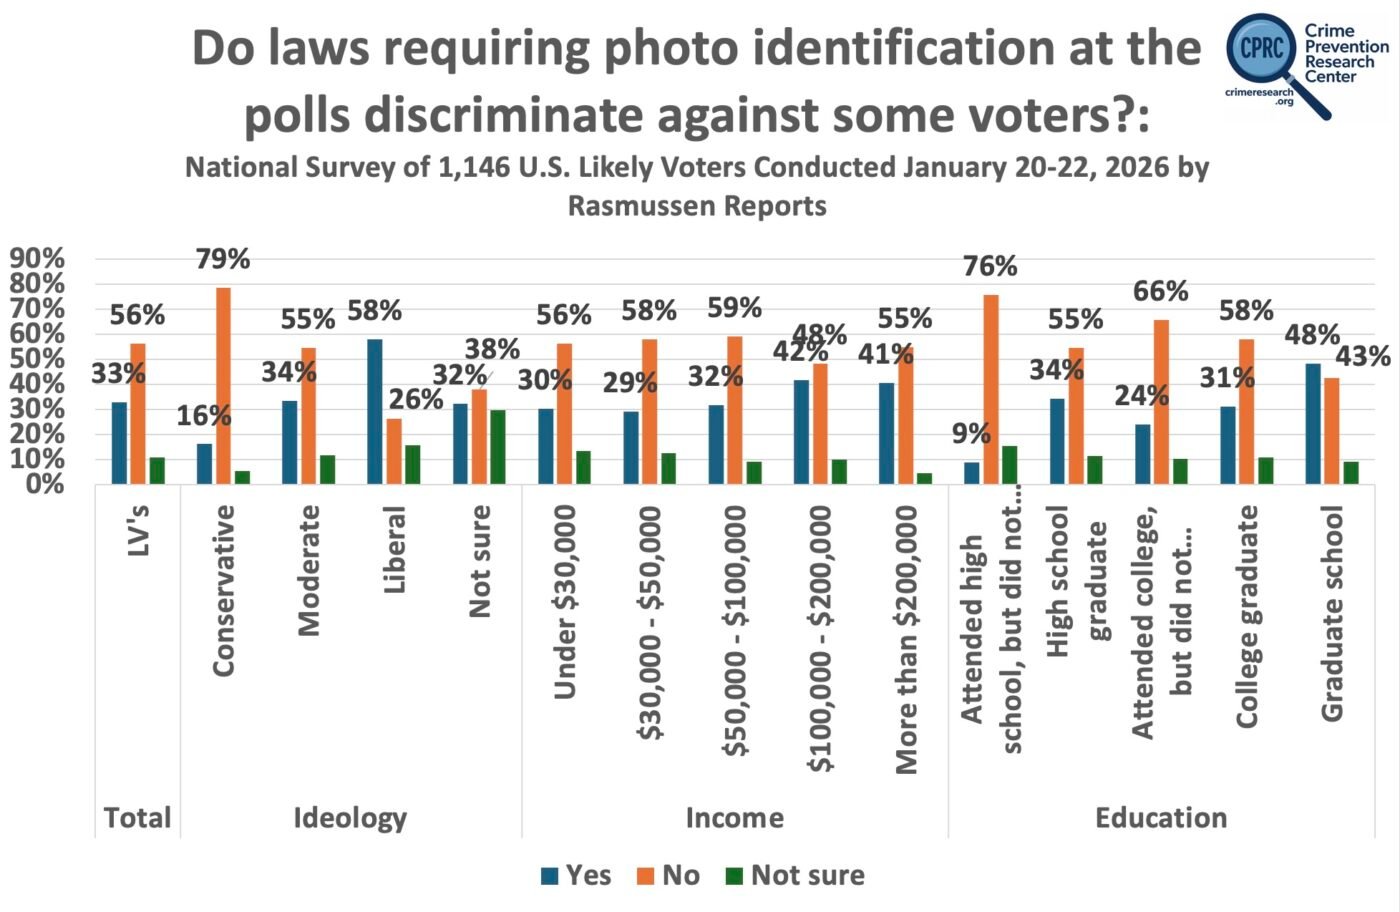
The least educated respondents—those most likely to face disenfranchisement—were the least likely to say that voter photo ID laws discriminate (9% yes to 76% no). By contrast, respondents with graduate degrees were more likely to believe that people with lower socioeconomic status could be disenfranchised (48% yes to 43% no). Income groups showed a similar but less pronounced pattern.


0 Comments