

Do more gun control laws mean fewer firearm deaths? Gun control advocates typically provide graphs looking across states that show more gun control laws related to fewer firearm deaths, but there are real problems with this approach. A Boston University School of Public Health project is one of the latest to make the rounds in various news outlets.
Few academics look at such purely cross-sectional data, simply because it is impossible in that case to accurately account for differences across different places. One of the classic comparisons is the homicide rates between the US and the UK. People will point out that the UK has strict gun control laws, few legally owned guns, and a low homicide rate. But the homicide rate in the UK has always been low, even before they had any gun control law. Indeed, when they banned handguns in January 1997 their homicide rates rose dramatically, up 45% over the next eight years and only came back down after a large increase in the number of police.
One other caution should also be raised. Lumping all the different gun control numbers into one number is pretty arbitrary. Not only is there the issue of what gun control laws to include, there is also the issue of how to weight them. Is a three day waiting period on buying guns the same as background checks on private transfers or a ban on open carrying of guns? Just adding up the number of laws in a state assumes that all the laws have the same importance. There is also the question of how many different ways that one divides up an existing law. For example, the Boston University dataset separately counts whether there is a background required to get a concealed handgun permit and also separately whether a background check is needed to renew the permit, but not whether training is required to get a permit (or the varying lengths of training) or the large differences in permit fees.
This discretion allows a lot of possible data manipulation. You can exclude or include what laws to use in constructing your score based on how it is correlated with homicides or suicides. The Brady Campaign index that we will use has a correlation coefficient of .86 with the Boston University index. Brady Campaign’s listing of gun control laws is a credible source from the perspective of gun control groups and because they would be less likely to be aware of how the index might be used by future statisticians they would be less likely to manipulate it to get their desired results at least when panel data is used (the bias would still be likely with purely cross-sectional data).
The typical academic approach for dealing with many different gun control laws is actually quite different. Rather than lumping all the laws together the normal approach is to simultaneously account for each law separately in a regression. For example, Dr. Lott’s book, More Guns, Less Crime (University of Chicago Press, 2010, 3rd edition), examines 13 different types of gun control laws and also accounts for differences in things such as the the length of waiting periods, the number of hours of training required to get a permit, and the yearly cost of a concealed handgun permit.
However, before we get into the problems with purely cross-sectional data, we will discuss how sensitive these claims are to even slight variations in how things are set up.
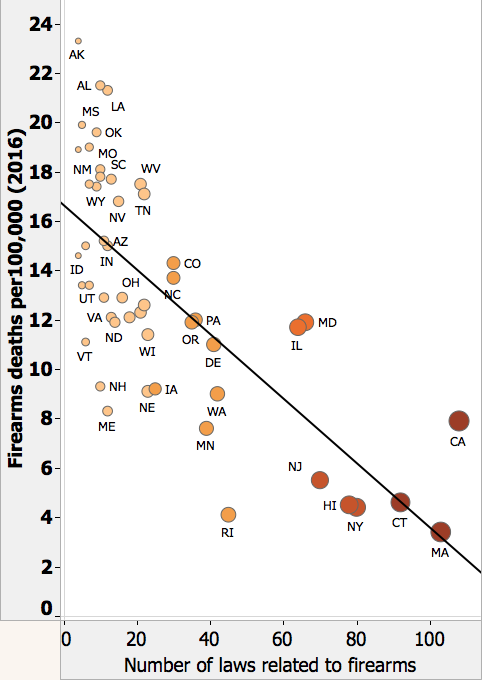
Below is a graph showing each state’s number of gun control laws in 2016 from the Boston University School of Public Health. The horizontal axis shows firearm deaths (firearm suicides and homicides) per 100,000 people. Click on the figure to enlarge.
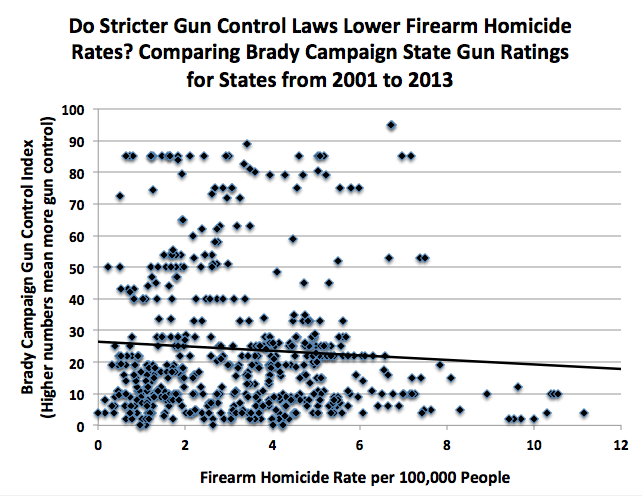
The Brady Campaign has been collecting information on the number of gun control laws by state from 2001 to 2013. We use the Brady Campaign because our later discussions depend on using the difference in state laws over many different years. The Brady Campaign didn’t release a report for 2005 and while the also have information for 2014, they used a different scale so it is hard to include that last year in the data that we will be showing you. The average state Brady Index score over this period of time is 24.1 with state rating ranging from 0 to 95 (standard deviation of 22.5). In any case, putting together graphs for the Brady Campaign’s collection of state laws and graphing that for total firearm deaths produces similar results to those shown by Boston University.


We now break down firearm deaths into two categories: firearm homicides and firearm suicides. While more gun laws mean fewer of both kinds of deaths, only the relationship for firearm suicides is statistically significant.
The relationship between the number of gun laws and firearm homicides in this estimate is very small. The effect of the number of gun laws explains about 3% of the variation in firearm homicides (this is from comparing the adjusted R2 with and without the index for the number of gun laws).


So even given this simple correlation that gun control advocates prefer, the result is driven by the supposed relationship between stricter gun laws and firearm suicides. Stricter gun laws are also statistically significantly related to fewer non-firearm suicides, while the negative relationship is not as pronounced as for firearm suicides, it is still not exactly what gun control advocates would predict. It is kind of hard to explain why stricter gun laws mean fewer non-firearm suicides.
More likely, stricter gun control laws happen to be associated with other factors, that in turn leads to a less suicide-prone environment. In a relatively famous economics paper on suicide, Cutler, Glaeser, and Norberg found that rural areas have both a large male-female population imbalance and also more gun ownership. But they argue that it is the high number of partnerless older men that causes more suicides in rural areas.


There is a real problem in simply comparing different places at a specific moment in time. Suppose, for the sake of argument, that high-crime states are the ones that most frequently adopt the most stringent gun control laws. What if gun control actually lowered crime, but not by enough to reduce rates to the same low levels prevailing in the majority of states that did not adopt the laws? With a simple comparison across countries, it would then falsely appear that stricter gun control resulted in higher crime. Economists refer to this as an “endogeneity” problem. The adoption of the policy is a reaction to other “endogenous” events — in this case, crime. To resolve this, one must examine how the high-crime areas that chose to adopt the controls changed over time — not only relative to their own past levels, but also relative to areas that did not adopt the law. Below is part of a long discussion in The Bias Against Guns, Chp. 5 (More Guns, Less Crime also has a long discussion in Chp. 2).
Unfortunately, many contemporary discussions rely on misinterpretations of cross-sectional data. The New York Times recently conducted a cross-sectional study of murder rates in states with and without the death penalty, and found that “Indeed, 10 of the 12 states without capital punishment have homicide rates below the national average, Federal Bureau of Investigation data shows, while half the states with the death penalty have homicide rates above the national average” (Raymond Bonner and Ford Fessenden, “States With No Death Penalty Share Lower Homicide Rates,” New York Times, September 22, 2000, p. A1.). However, they erroneously concluded that the death penalty did not deter murder. The problem is that the states without the death penalty (Alaska, Hawaii, Iowa, Maine, Massachusetts, Michigan, Minnesota, North Dakota, Rhode Island, West Virginia, Wisconsin, and Vermont) have long enjoyed relatively low murder rates, something that might well have more to do with other factors than the death penalty. Instead one must compare, over time, how murder rates change in the two groups – those adopting the death penalty and those that did not.
To solve this problem academics look at what is called panel data, where we follow different states over time to see how the murder rates change after a state adopts a law such as the death penalty and how their murder rate changes relative to the states that aren’t changing their law. In this case, rather than looking at the death penalty, we are looking at the impact of all these different gun control laws in the Brady index. We don’t want to falsely attribute changes in gun control laws to national trends in crime rates. The issue isn’t whether crime rates are falling nationally when states change their gun control laws, but whether the ones that are changing their laws have a bigger or smaller drop in crime relative to the states that aren’t changing their laws. We also want to see whether a state’s crime rates go up or down after they change their gun laws.
The way to measure whether a state’s homicide and suicide rates are changing not only relative to their own past levels, but also relative to areas that did not adopt so many gun control laws is through fixed year and state effects, which account for the average national changes in crime or suicides rates from year to year and the average crime rates for each state to see how crime rates change over time relative to that average.
Next are the regressions for all firearm deaths, firearm homicides and firearm suicides that account for these fixed year and state effects. In each case, the impact of the Brady Campaign’s measure of gun control laws goes from being negative (implying that more gun control laws mean fewer deaths) to positive (implying that more gun control laws mean more deaths), though in none of these cases is the effect statistically significant. Not all the results for state and year fixed effects are shown below because we are focusing on the coefficient for the Brady law index.
The effect of the number of gun laws explains about 3% of the variation in total deaths from homicides plus suicides (this is from comparing the adjusted R2 with and without the index for the number of gun laws).


The ultimate question is really whether total deaths go up or down with more gun control. Total homicides and total suicides are actually more important than firearm homicides and suicides because of the possibility of substitutability between different ways of killing people or committing suicide. For example, if all guns were eliminated and people still committed suicide at the same rate that they did previously, there would have been no benefit in terms of suicides from eliminating guns. To examine this, we reran these last three regressions for total deaths (homicides and suicides), total homicides, and total suicides. These continue to show that more gun control is associated with more deaths — both homicides and suicides. While there is a statistically significant relationship between more gun control laws and more total suicides, the effect is not statistically significant for total homicides.
This graph illustrates the results shown in the first regression showing the relationship between homicides and suicides with the number of gun control laws. The effect of the number of gun laws explains about 4% of the variation in total deaths from homicides plus suicides (this is from comparing the adjusted R2 with and without the index for the number of gun laws).
To put it differently, increasing the index of the gun laws in a state by 20 percentage points (about one standard deviation) is associated with an increase in the total death rate (homicides plus suicides) of 0.4 per 100,000 people.


Conclusion
Once one accounts for the average pre-existing differences in homicide and suicide rates across states and the average annual changes in those deaths from year-to-year, stricter gun laws are associated with more total deaths from homicides and suicides. increasing the index of the gun laws in a state by 20 percentage points (about one standard deviation) is associated with an increase in the total death rate (homicides plus suicides) of 0.4 per 100,000 people. While we might disagree with how the Brady Campaign rates state gun control laws from year-to-year, this relationship is found using their ratings.
.


Thanks, Dr. Lott, for your work.
Thank you, Ed. Any support is greatly appreciated.
Dr. Lott, thank you for your work in this area! Saw you on Crowder and really enjoyed the thoughtful interview!
Dr. Lott, I also just saw you on Crowder and bought your latest book off amazon by the end. I look forward to reading it.
Thank you very much, Michael. That is very appreciated.