
Updated school shooting data is available here.


(Click on a figure to make it larger.)
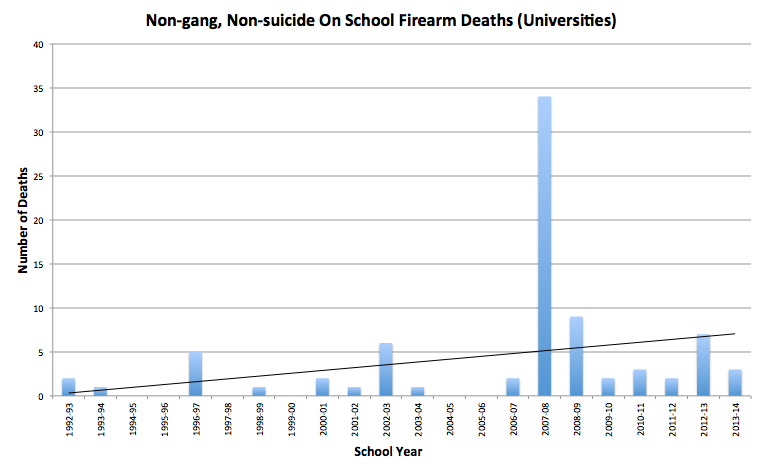
Using data from the National School Safety Center, Slate, Michael Bloomberg (as viewed on June 13, 2014), and CNN shows a significant drop in firearms deaths at schools over the last 20 years, though there is a difference when one breaks it down separately for K-12 and universities. The National School Safety Center already has done a good job of noting whether the shootings involved gangs and whether they occurred on or near school property. Bloomberg and Slate were nowhere near as careful, and required a systematic search of news stories. Bloomberg’s analysis contains late night lone suicides involving people completely unrelated to the school, late night gang fights, cases off of school property, defensive gun use, and other cases that are unrelated to the Newtown type massacres. Bloomberg counts this as a Newtown like attack:
• A student at Eastern Florida State College retrieved his gun from his car when two men attacked him. One of the men was striking the student with a pool cue, and the student fired his gun wounding him. The gun was legally stored in the student’s car and the police found that he had acted in self-defense.
Politifact found that the latest Bloomberg claims of 74 school shootings were “mostly false.” CNN redid the numbers and found that if you included both K-12 and universities the total was 15 (the June school shooting in Oregon occurred right after their list of schools). We used the Bloomberg claims for the 2012-13 school year and the CNN list for the 2013-14 year.
Information on shootings at universities is available here (click to make screen shot larger).

UPDATE: While we didn’t get credit for the CNN report, our Director of Communications, Rebekah Riley, told CNN about our February report at Fox News on an earlier version of their report and it obviously served as the basis for the work that they did. John Lott told Charles Johnson about our study before he tweeted out the mistakes, so we were ultimately responsible for that getting out also.
UPDATE: Chris Sha in The Daily Targum (Rutgers University) has this observation:
What causes higher fatality rates in the United States per year: school shootings or lightning strikes? According to the data from the Crime Prevention Research Center and the National Weather Service, lightning is significantly more deadly. Anyone who thinks otherwise is experiencing a phenomenon called the “availability heuristic.” This bias sways our judgment of likelihood, based on how easily examples are called to mind. Lightning strikes consistently cause more death than school shootings, but how often do you see a “Death by Strike” headline in the news? Almost never. Our perceptions are highly influenced by media and it has perverted our perception on the concept of success. . . .




You know, this doesn’t actually help your cause, considering there was an “assault weapons” ban from 1994-2004. In fact, this data could be used to make an argument FOR tighter restrictions.